Free Statistics

of Irreproducible Research!

Author's title

Author*The author of this computation has been verified*
R Software Modulerwasp_cross.wasp
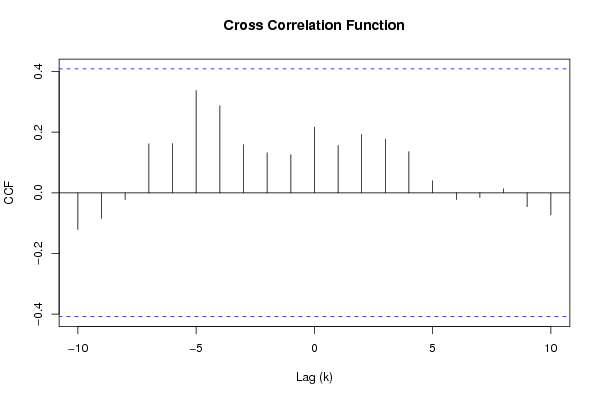
Title produced by softwareCross Correlation Function
Date of computationTue, 02 Dec 2008 08:51:26 -0700
Cite this page as followsStatistical Computations at FreeStatistics.org, Office for Research Development and Education, URL https://freestatistics.org/blog/index.php?v=date/2008/Dec/02/t1228233180cihlm49rovc206b.htm/, Retrieved Fri, 17 May 2024 05:44:33 +0000
Statistical Computations at FreeStatistics.org, Office for Research Development and Education, URL https://freestatistics.org/blog/index.php?pk=27975, Retrieved Fri, 17 May 2024 05:44:33 +0000
QR Codes:

Original text written by user:
IsPrivate?No (this computation is public)
User-defined keywords
Estimated Impact176
Family? (F = Feedback message, R = changed R code, M = changed R Module, P = changed Parameters, D = changed Data)
F     [Univariate Data Series] [Airline data] [2007-10-18 09:58:47] [42daae401fd3def69a25014f2252b4c2]
F RMPD  [Spectral Analysis] [question 6] [2008-12-01 14:22:49] [379d6c32f73e3218fd773d79e4063d07]
F RMPD    [Cross Correlation Function] [Q7] [2008-12-02 15:40:53] [d811f621c525a990f9b60f1ae1e2e8fd]
F   P         [Cross Correlation Function] [Q7] [2008-12-02 15:51:26] [f4914427e726625a358be9269a8b7d03] [Current]
Feedback Forum
2008-12-06 13:20:43 [Bert Moons] [reply
Aangezien vraag 8 niet opgelost is en er verder geen onderzoek is gedaan kan ik er enkel van uitgaan dat dit de meest geschikte transformaties zijn. Er is inderdaad sprakle van stationairiteit na de transformaties.
2008-12-08 15:27:04 [Alexander Hendrickx] [reply
De functie is stationair na transformatie.

Post a new message
Dataseries X:
168.8
169.8
171.2
171.3
171.5
172.4
172.8
172.8
173.7
174
174.1
174
175.1
175.8
176.2
176.9
177.7
178
177.5
177.5
178.3
177.7
177.4
176.7
177.1
177.8
178.8
179.8
179.8
179.9
180.1
180.7
181
181.3
181.3
180.9
Dataseries Y:
179.3
180.5
181.5
181.4
181.4
182
182.8
183.1
184.4
184.6
184.6
184.2
184.9
185.3
186.4
186.6
187.3
188.3
187.8
188.1
188
187.8
187.8
187.3
188.5
189.9
191.1
191.8
191.4
191.5
192
193.1
193.3
193.7
193.4
193.1


Summary of computational transaction
Raw Inputview raw input (R code)
Raw Outputview raw output of R engine
Computing time1 seconds
R Server'Gwilym Jenkins' @ 72.249.127.135

\begin{tabular}{lllllllll}
\hline
Summary of computational transaction \tabularnewline
Raw Input & view raw input (R code)  \tabularnewline
Raw Output & view raw output of R engine  \tabularnewline
Computing time & 1 seconds \tabularnewline
R Server & 'Gwilym Jenkins' @ 72.249.127.135 \tabularnewline
\hline
\end{tabular}
%Source: https://freestatistics.org/blog/index.php?pk=27975&T=0

[TABLE]
[ROW][C]Summary of computational transaction[/C][/ROW]
[ROW][C]Raw Input[/C][C]view raw input (R code) [/C][/ROW]
[ROW][C]Raw Output[/C][C]view raw output of R engine [/C][/ROW]
[ROW][C]Computing time[/C][C]1 seconds[/C][/ROW]
[ROW][C]R Server[/C][C]'Gwilym Jenkins' @ 72.249.127.135[/C][/ROW]
[/TABLE]
Source: https://freestatistics.org/blog/index.php?pk=27975&T=0

Globally Unique Identifier (entire table): ba.freestatistics.org/blog/index.php?pk=27975&T=0

As an alternative you can also use a QR Code:  

The GUIDs for individual cells are displayed in the table below:

Summary of computational transaction
Raw Inputview raw input (R code)
Raw Outputview raw output of R engine
Computing time1 seconds
R Server'Gwilym Jenkins' @ 72.249.127.135


Cross Correlation Function
ParameterValue
Box-Cox transformation parameter (lambda) of X series1
Degree of non-seasonal differencing (d) of X series0
Degree of seasonal differencing (D) of X series0
Seasonal Period (s)12
Box-Cox transformation parameter (lambda) of Y series1
Degree of non-seasonal differencing (d) of Y series1
Degree of seasonal differencing (D) of Y series1
krho(Y[t],X[t+k])
-10-0.121290067171431
-9-0.0844292085406412
-8-0.0225177432036150
-70.161449429984308
-60.162631262904299
-50.337739790629361
-40.286845303753318
-30.158520779989409
-20.131855568452193
-10.125968084959768
00.216596814893291
10.156298679027976
20.192409201290499
30.177049624528181
40.135778998674706
50.0401636140104295
6-0.0224714051502767
7-0.0151465917648690
80.0133470598402938
9-0.0459244118157512
10-0.0731444046337573

\begin{tabular}{lllllllll}
\hline
Cross Correlation Function \tabularnewline
Parameter & Value \tabularnewline
Box-Cox transformation parameter (lambda) of X series & 1 \tabularnewline
Degree of non-seasonal differencing (d) of X series & 0 \tabularnewline
Degree of seasonal differencing (D) of X series & 0 \tabularnewline
Seasonal Period (s) & 12 \tabularnewline
Box-Cox transformation parameter (lambda) of Y series & 1 \tabularnewline
Degree of non-seasonal differencing (d) of Y series & 1 \tabularnewline
Degree of seasonal differencing (D) of Y series & 1 \tabularnewline
k & rho(Y[t],X[t+k]) \tabularnewline
-10 & -0.121290067171431 \tabularnewline
-9 & -0.0844292085406412 \tabularnewline
-8 & -0.0225177432036150 \tabularnewline
-7 & 0.161449429984308 \tabularnewline
-6 & 0.162631262904299 \tabularnewline
-5 & 0.337739790629361 \tabularnewline
-4 & 0.286845303753318 \tabularnewline
-3 & 0.158520779989409 \tabularnewline
-2 & 0.131855568452193 \tabularnewline
-1 & 0.125968084959768 \tabularnewline
0 & 0.216596814893291 \tabularnewline
1 & 0.156298679027976 \tabularnewline
2 & 0.192409201290499 \tabularnewline
3 & 0.177049624528181 \tabularnewline
4 & 0.135778998674706 \tabularnewline
5 & 0.0401636140104295 \tabularnewline
6 & -0.0224714051502767 \tabularnewline
7 & -0.0151465917648690 \tabularnewline
8 & 0.0133470598402938 \tabularnewline
9 & -0.0459244118157512 \tabularnewline
10 & -0.0731444046337573 \tabularnewline
\hline
\end{tabular}
%Source: https://freestatistics.org/blog/index.php?pk=27975&T=1

[TABLE]
[ROW][C]Cross Correlation Function[/C][/ROW]
[ROW][C]Parameter[/C][C]Value[/C][/ROW]
[ROW][C]Box-Cox transformation parameter (lambda) of X series[/C][C]1[/C][/ROW]
[ROW][C]Degree of non-seasonal differencing (d) of X series[/C][C]0[/C][/ROW]
[ROW][C]Degree of seasonal differencing (D) of X series[/C][C]0[/C][/ROW]
[ROW][C]Seasonal Period (s)[/C][C]12[/C][/ROW]
[ROW][C]Box-Cox transformation parameter (lambda) of Y series[/C][C]1[/C][/ROW]
[ROW][C]Degree of non-seasonal differencing (d) of Y series[/C][C]1[/C][/ROW]
[ROW][C]Degree of seasonal differencing (D) of Y series[/C][C]1[/C][/ROW]
[ROW][C]k[/C][C]rho(Y[t],X[t+k])[/C][/ROW]
[ROW][C]-10[/C][C]-0.121290067171431[/C][/ROW]
[ROW][C]-9[/C][C]-0.0844292085406412[/C][/ROW]
[ROW][C]-8[/C][C]-0.0225177432036150[/C][/ROW]
[ROW][C]-7[/C][C]0.161449429984308[/C][/ROW]
[ROW][C]-6[/C][C]0.162631262904299[/C][/ROW]
[ROW][C]-5[/C][C]0.337739790629361[/C][/ROW]
[ROW][C]-4[/C][C]0.286845303753318[/C][/ROW]
[ROW][C]-3[/C][C]0.158520779989409[/C][/ROW]
[ROW][C]-2[/C][C]0.131855568452193[/C][/ROW]
[ROW][C]-1[/C][C]0.125968084959768[/C][/ROW]
[ROW][C]0[/C][C]0.216596814893291[/C][/ROW]
[ROW][C]1[/C][C]0.156298679027976[/C][/ROW]
[ROW][C]2[/C][C]0.192409201290499[/C][/ROW]
[ROW][C]3[/C][C]0.177049624528181[/C][/ROW]
[ROW][C]4[/C][C]0.135778998674706[/C][/ROW]
[ROW][C]5[/C][C]0.0401636140104295[/C][/ROW]
[ROW][C]6[/C][C]-0.0224714051502767[/C][/ROW]
[ROW][C]7[/C][C]-0.0151465917648690[/C][/ROW]
[ROW][C]8[/C][C]0.0133470598402938[/C][/ROW]
[ROW][C]9[/C][C]-0.0459244118157512[/C][/ROW]
[ROW][C]10[/C][C]-0.0731444046337573[/C][/ROW]
[/TABLE]
Source: https://freestatistics.org/blog/index.php?pk=27975&T=1

Globally Unique Identifier (entire table): ba.freestatistics.org/blog/index.php?pk=27975&T=1

As an alternative you can also use a QR Code:  

The GUIDs for individual cells are displayed in the table below:

Cross Correlation Function
ParameterValue
Box-Cox transformation parameter (lambda) of X series1
Degree of non-seasonal differencing (d) of X series0
Degree of seasonal differencing (D) of X series0
Seasonal Period (s)12
Box-Cox transformation parameter (lambda) of Y series1
Degree of non-seasonal differencing (d) of Y series1
Degree of seasonal differencing (D) of Y series1
krho(Y[t],X[t+k])
-10-0.121290067171431
-9-0.0844292085406412
-8-0.0225177432036150
-70.161449429984308
-60.162631262904299
-50.337739790629361
-40.286845303753318
-30.158520779989409
-20.131855568452193
-10.125968084959768
00.216596814893291
10.156298679027976
20.192409201290499
30.177049624528181
40.135778998674706
50.0401636140104295
6-0.0224714051502767
7-0.0151465917648690
80.0133470598402938
9-0.0459244118157512
10-0.0731444046337573


Parameters (Session):
par1 = 1 ; par2 = 0 ; par3 = 0 ; par4 = 12 ; par5 = 1 ; par6 = 1 ; par7 = 1 ;
Parameters (R input):
par1 = 1 ; par2 = 0 ; par3 = 0 ; par4 = 12 ; par5 = 1 ; par6 = 1 ; par7 = 1 ;
R code (references can be found in the software module):
par1 <- as.numeric(par1)
par2 <- as.numeric(par2)
par3 <- as.numeric(par3)
par4 <- as.numeric(par4)
par5 <- as.numeric(par5)
par6 <- as.numeric(par6)
par7 <- as.numeric(par7)
if (par1 == 0) {
x <- log(x)
} else {
x <- (x ^ par1 - 1) / par1
}
if (par5 == 0) {
y <- log(y)
} else {
y <- (y ^ par5 - 1) / par5
}
if (par2 > 0) x <- diff(x,lag=1,difference=par2)
if (par6 > 0) y <- diff(y,lag=1,difference=par6)
if (par3 > 0) x <- diff(x,lag=par4,difference=par3)
if (par7 > 0) y <- diff(y,lag=par4,difference=par7)
x
y
bitmap(file='test1.png')
(r <- ccf(x,y,main='Cross Correlation Function',ylab='CCF',xlab='Lag (k)'))
dev.off()
load(file='createtable')
a<-table.start()
a<-table.row.start(a)
a<-table.element(a,'Cross Correlation Function',2,TRUE)
a<-table.row.end(a)
a<-table.row.start(a)
a<-table.element(a,'Parameter',header=TRUE)
a<-table.element(a,'Value',header=TRUE)
a<-table.row.end(a)
a<-table.row.start(a)
a<-table.element(a,'Box-Cox transformation parameter (lambda) of X series',header=TRUE)
a<-table.element(a,par1)
a<-table.row.end(a)
a<-table.row.start(a)
a<-table.element(a,'Degree of non-seasonal differencing (d) of X series',header=TRUE)
a<-table.element(a,par2)
a<-table.row.end(a)
a<-table.row.start(a)
a<-table.element(a,'Degree of seasonal differencing (D) of X series',header=TRUE)
a<-table.element(a,par3)
a<-table.row.end(a)
a<-table.row.start(a)
a<-table.element(a,'Seasonal Period (s)',header=TRUE)
a<-table.element(a,par4)
a<-table.row.end(a)
a<-table.row.start(a)
a<-table.element(a,'Box-Cox transformation parameter (lambda) of Y series',header=TRUE)
a<-table.element(a,par5)
a<-table.row.end(a)
a<-table.row.start(a)
a<-table.element(a,'Degree of non-seasonal differencing (d) of Y series',header=TRUE)
a<-table.element(a,par6)
a<-table.row.end(a)
a<-table.row.start(a)
a<-table.element(a,'Degree of seasonal differencing (D) of Y series',header=TRUE)
a<-table.element(a,par7)
a<-table.row.end(a)
a<-table.row.start(a)
a<-table.element(a,'k',header=TRUE)
a<-table.element(a,'rho(Y[t],X[t+k])',header=TRUE)
a<-table.row.end(a)
mylength <- length(r$acf)
myhalf <- floor((mylength-1)/2)
for (i in 1:mylength) {
a<-table.row.start(a)
a<-table.element(a,i-myhalf-1,header=TRUE)
a<-table.element(a,r$acf[i])
a<-table.row.end(a)
}
a<-table.end(a)
table.save(a,file='mytable.tab')