Free Statistics

of Irreproducible Research!

Author's title

Author*Unverified author*
R Software Modulerwasp_cross.wasp
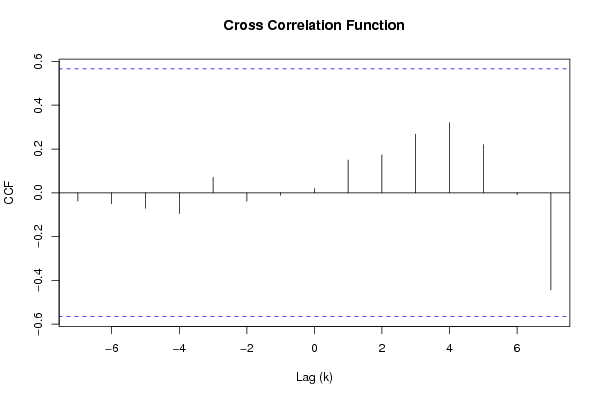
Title produced by softwareCross Correlation Function
Date of computationTue, 02 Dec 2008 08:12:07 -0700
Cite this page as followsStatistical Computations at FreeStatistics.org, Office for Research Development and Education, URL https://freestatistics.org/blog/index.php?v=date/2008/Dec/02/t1228230767mu7lu872a7x38uf.htm/, Retrieved Fri, 17 May 2024 03:20:24 +0000
Statistical Computations at FreeStatistics.org, Office for Research Development and Education, URL https://freestatistics.org/blog/index.php?pk=27928, Retrieved Fri, 17 May 2024 03:20:24 +0000
QR Codes:

Original text written by user:
IsPrivate?No (this computation is public)
User-defined keywords
Estimated Impact166
Family? (F = Feedback message, R = changed R code, M = changed R Module, P = changed Parameters, D = changed Data)
F       [Cross Correlation Function] [q8] [2008-12-02 15:12:07] [626e377fc325feb39b4d1ec8dd6da88c] [Current]
Feedback Forum
2008-12-08 16:11:39 [Jonas Scheltjens] [reply
De student geeft hier helemaal geen antwoord. We gebruiken de variance reduction matrix en zijn waarden omdat we hier de parameters het gemakkelijkst kunnen aflezen. We kunnen verder nog vermelden dat deze methode minder betrouwbaar is omdat deze gevoelig is voor outliers. Indien deze aanwezig zijn is het beter te werken met de getrimde varianties. Hier uit zijn de 5% hoogste en laagste waarden uit de reeks weggelaten. Dit geeft dan een betrouwbaarder beeld. Het klopt dat de parameter d de waarde 1 krijgt en D de waarde 0. Dit is duidelijk te zien in de tabel.

Post a new message
Dataseries X:
1.2732
1.2733
1.2734
1.2735
1.2736
1.2737
1.2738
1.2739
1.2740
1.2741
1.2742
1.2743
1.2744
1.2745
1.2746
1.2747
1.2748
1.2749
1.2750
1.2751
1.2752
1.2753
1.2754
1.2755
1.2756
Dataseries Y:
123.28
133.52
153.20
163.63
168.45
166.26
162.31
161.56
156.59
157.97
158.68
163.55
162.89
164.95
159.82
159.05
166.76
164.55
163.22
160.68
155.24
157.60
156.56
154.82
151.11


Summary of computational transaction
Raw Inputview raw input (R code)
Raw Outputview raw output of R engine
Computing time1 seconds
R Server'Gwilym Jenkins' @ 72.249.127.135

\begin{tabular}{lllllllll}
\hline
Summary of computational transaction \tabularnewline
Raw Input & view raw input (R code)  \tabularnewline
Raw Output & view raw output of R engine  \tabularnewline
Computing time & 1 seconds \tabularnewline
R Server & 'Gwilym Jenkins' @ 72.249.127.135 \tabularnewline
\hline
\end{tabular}
%Source: https://freestatistics.org/blog/index.php?pk=27928&T=0

[TABLE]
[ROW][C]Summary of computational transaction[/C][/ROW]
[ROW][C]Raw Input[/C][C]view raw input (R code) [/C][/ROW]
[ROW][C]Raw Output[/C][C]view raw output of R engine [/C][/ROW]
[ROW][C]Computing time[/C][C]1 seconds[/C][/ROW]
[ROW][C]R Server[/C][C]'Gwilym Jenkins' @ 72.249.127.135[/C][/ROW]
[/TABLE]
Source: https://freestatistics.org/blog/index.php?pk=27928&T=0

Globally Unique Identifier (entire table): ba.freestatistics.org/blog/index.php?pk=27928&T=0

As an alternative you can also use a QR Code:  

The GUIDs for individual cells are displayed in the table below:

Summary of computational transaction
Raw Inputview raw input (R code)
Raw Outputview raw output of R engine
Computing time1 seconds
R Server'Gwilym Jenkins' @ 72.249.127.135


Cross Correlation Function
ParameterValue
Box-Cox transformation parameter (lambda) of X series1
Degree of non-seasonal differencing (d) of X series1
Degree of seasonal differencing (D) of X series1
Seasonal Period (s)12
Box-Cox transformation parameter (lambda) of Y series1
Degree of non-seasonal differencing (d) of Y series0
Degree of seasonal differencing (D) of Y series0
krho(Y[t],X[t+k])
-7-0.0377644165740058
-6-0.0504039355906118
-5-0.0706541406004485
-4-0.095123941135646
-30.0700375786971997
-2-0.0376488112171464
-1-0.0112329871748191
00.0194216999523459
10.149362121062088
20.172348319517593
30.267953949640152
40.320207570940511
50.219958458984107
6-0.00855479640758111
7-0.44332727599556

\begin{tabular}{lllllllll}
\hline
Cross Correlation Function \tabularnewline
Parameter & Value \tabularnewline
Box-Cox transformation parameter (lambda) of X series & 1 \tabularnewline
Degree of non-seasonal differencing (d) of X series & 1 \tabularnewline
Degree of seasonal differencing (D) of X series & 1 \tabularnewline
Seasonal Period (s) & 12 \tabularnewline
Box-Cox transformation parameter (lambda) of Y series & 1 \tabularnewline
Degree of non-seasonal differencing (d) of Y series & 0 \tabularnewline
Degree of seasonal differencing (D) of Y series & 0 \tabularnewline
k & rho(Y[t],X[t+k]) \tabularnewline
-7 & -0.0377644165740058 \tabularnewline
-6 & -0.0504039355906118 \tabularnewline
-5 & -0.0706541406004485 \tabularnewline
-4 & -0.095123941135646 \tabularnewline
-3 & 0.0700375786971997 \tabularnewline
-2 & -0.0376488112171464 \tabularnewline
-1 & -0.0112329871748191 \tabularnewline
0 & 0.0194216999523459 \tabularnewline
1 & 0.149362121062088 \tabularnewline
2 & 0.172348319517593 \tabularnewline
3 & 0.267953949640152 \tabularnewline
4 & 0.320207570940511 \tabularnewline
5 & 0.219958458984107 \tabularnewline
6 & -0.00855479640758111 \tabularnewline
7 & -0.44332727599556 \tabularnewline
\hline
\end{tabular}
%Source: https://freestatistics.org/blog/index.php?pk=27928&T=1

[TABLE]
[ROW][C]Cross Correlation Function[/C][/ROW]
[ROW][C]Parameter[/C][C]Value[/C][/ROW]
[ROW][C]Box-Cox transformation parameter (lambda) of X series[/C][C]1[/C][/ROW]
[ROW][C]Degree of non-seasonal differencing (d) of X series[/C][C]1[/C][/ROW]
[ROW][C]Degree of seasonal differencing (D) of X series[/C][C]1[/C][/ROW]
[ROW][C]Seasonal Period (s)[/C][C]12[/C][/ROW]
[ROW][C]Box-Cox transformation parameter (lambda) of Y series[/C][C]1[/C][/ROW]
[ROW][C]Degree of non-seasonal differencing (d) of Y series[/C][C]0[/C][/ROW]
[ROW][C]Degree of seasonal differencing (D) of Y series[/C][C]0[/C][/ROW]
[ROW][C]k[/C][C]rho(Y[t],X[t+k])[/C][/ROW]
[ROW][C]-7[/C][C]-0.0377644165740058[/C][/ROW]
[ROW][C]-6[/C][C]-0.0504039355906118[/C][/ROW]
[ROW][C]-5[/C][C]-0.0706541406004485[/C][/ROW]
[ROW][C]-4[/C][C]-0.095123941135646[/C][/ROW]
[ROW][C]-3[/C][C]0.0700375786971997[/C][/ROW]
[ROW][C]-2[/C][C]-0.0376488112171464[/C][/ROW]
[ROW][C]-1[/C][C]-0.0112329871748191[/C][/ROW]
[ROW][C]0[/C][C]0.0194216999523459[/C][/ROW]
[ROW][C]1[/C][C]0.149362121062088[/C][/ROW]
[ROW][C]2[/C][C]0.172348319517593[/C][/ROW]
[ROW][C]3[/C][C]0.267953949640152[/C][/ROW]
[ROW][C]4[/C][C]0.320207570940511[/C][/ROW]
[ROW][C]5[/C][C]0.219958458984107[/C][/ROW]
[ROW][C]6[/C][C]-0.00855479640758111[/C][/ROW]
[ROW][C]7[/C][C]-0.44332727599556[/C][/ROW]
[/TABLE]
Source: https://freestatistics.org/blog/index.php?pk=27928&T=1

Globally Unique Identifier (entire table): ba.freestatistics.org/blog/index.php?pk=27928&T=1

As an alternative you can also use a QR Code:  

The GUIDs for individual cells are displayed in the table below:

Cross Correlation Function
ParameterValue
Box-Cox transformation parameter (lambda) of X series1
Degree of non-seasonal differencing (d) of X series1
Degree of seasonal differencing (D) of X series1
Seasonal Period (s)12
Box-Cox transformation parameter (lambda) of Y series1
Degree of non-seasonal differencing (d) of Y series0
Degree of seasonal differencing (D) of Y series0
krho(Y[t],X[t+k])
-7-0.0377644165740058
-6-0.0504039355906118
-5-0.0706541406004485
-4-0.095123941135646
-30.0700375786971997
-2-0.0376488112171464
-1-0.0112329871748191
00.0194216999523459
10.149362121062088
20.172348319517593
30.267953949640152
40.320207570940511
50.219958458984107
6-0.00855479640758111
7-0.44332727599556


Parameters (Session):
par1 = 1 ; par2 = 1 ; par3 = 1 ; par4 = 12 ; par5 = 1 ; par6 = 0 ; par7 = 0 ;
Parameters (R input):
par1 = 1 ; par2 = 1 ; par3 = 1 ; par4 = 12 ; par5 = 1 ; par6 = 0 ; par7 = 0 ;
R code (references can be found in the software module):
par1 <- as.numeric(par1)
par2 <- as.numeric(par2)
par3 <- as.numeric(par3)
par4 <- as.numeric(par4)
par5 <- as.numeric(par5)
par6 <- as.numeric(par6)
par7 <- as.numeric(par7)
if (par1 == 0) {
x <- log(x)
} else {
x <- (x ^ par1 - 1) / par1
}
if (par5 == 0) {
y <- log(y)
} else {
y <- (y ^ par5 - 1) / par5
}
if (par2 > 0) x <- diff(x,lag=1,difference=par2)
if (par6 > 0) y <- diff(y,lag=1,difference=par6)
if (par3 > 0) x <- diff(x,lag=par4,difference=par3)
if (par7 > 0) y <- diff(y,lag=par4,difference=par7)
x
y
bitmap(file='test1.png')
(r <- ccf(x,y,main='Cross Correlation Function',ylab='CCF',xlab='Lag (k)'))
dev.off()
load(file='createtable')
a<-table.start()
a<-table.row.start(a)
a<-table.element(a,'Cross Correlation Function',2,TRUE)
a<-table.row.end(a)
a<-table.row.start(a)
a<-table.element(a,'Parameter',header=TRUE)
a<-table.element(a,'Value',header=TRUE)
a<-table.row.end(a)
a<-table.row.start(a)
a<-table.element(a,'Box-Cox transformation parameter (lambda) of X series',header=TRUE)
a<-table.element(a,par1)
a<-table.row.end(a)
a<-table.row.start(a)
a<-table.element(a,'Degree of non-seasonal differencing (d) of X series',header=TRUE)
a<-table.element(a,par2)
a<-table.row.end(a)
a<-table.row.start(a)
a<-table.element(a,'Degree of seasonal differencing (D) of X series',header=TRUE)
a<-table.element(a,par3)
a<-table.row.end(a)
a<-table.row.start(a)
a<-table.element(a,'Seasonal Period (s)',header=TRUE)
a<-table.element(a,par4)
a<-table.row.end(a)
a<-table.row.start(a)
a<-table.element(a,'Box-Cox transformation parameter (lambda) of Y series',header=TRUE)
a<-table.element(a,par5)
a<-table.row.end(a)
a<-table.row.start(a)
a<-table.element(a,'Degree of non-seasonal differencing (d) of Y series',header=TRUE)
a<-table.element(a,par6)
a<-table.row.end(a)
a<-table.row.start(a)
a<-table.element(a,'Degree of seasonal differencing (D) of Y series',header=TRUE)
a<-table.element(a,par7)
a<-table.row.end(a)
a<-table.row.start(a)
a<-table.element(a,'k',header=TRUE)
a<-table.element(a,'rho(Y[t],X[t+k])',header=TRUE)
a<-table.row.end(a)
mylength <- length(r$acf)
myhalf <- floor((mylength-1)/2)
for (i in 1:mylength) {
a<-table.row.start(a)
a<-table.element(a,i-myhalf-1,header=TRUE)
a<-table.element(a,r$acf[i])
a<-table.row.end(a)
}
a<-table.end(a)
table.save(a,file='mytable.tab')