Free Statistics

of Irreproducible Research!

Author's title

Author*Unverified author*
R Software Modulerwasp_smp.wasp
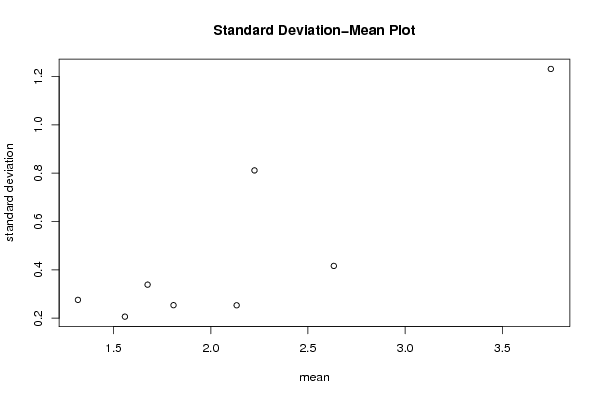
Title produced by softwareStandard Deviation-Mean Plot
Date of computationTue, 02 Dec 2008 06:23:50 -0700
Cite this page as followsStatistical Computations at FreeStatistics.org, Office for Research Development and Education, URL https://freestatistics.org/blog/index.php?v=date/2008/Dec/02/t12282243300e2z9vbr7zo7scp.htm/, Retrieved Fri, 17 May 2024 07:00:12 +0000
Statistical Computations at FreeStatistics.org, Office for Research Development and Education, URL https://freestatistics.org/blog/index.php?pk=27746, Retrieved Fri, 17 May 2024 07:00:12 +0000
QR Codes:

Original text written by user:
IsPrivate?No (this computation is public)
User-defined keywords
Estimated Impact212
Family? (F = Feedback message, R = changed R code, M = changed R Module, P = changed Parameters, D = changed Data)
F       [Standard Deviation-Mean Plot] [] [2008-12-02 13:23:50] [d41d8cd98f00b204e9800998ecf8427e] [Current]
- RMP     [ARIMA Forecasting] [] [2008-12-11 11:41:43] [74be16979710d4c4e7c6647856088456]
Feedback Forum
2008-12-04 09:51:29 [Evelyn Gabriel] [reply
Ook dit heeft de student goed uitgewerkt. De tabel is goed geïnterpreteerd.
Dit leidt inderdaad tot een lambda van -0,52.
2008-12-05 19:55:29 [Bert Moons] [reply
Inderdaad de lambda waarde is -0.52,j en significant omdat de P-waarde onder de 0.05 is.
2008-12-06 16:25:50 [Bénédicte Soens] [reply
Er werd een juist antwoord gegeven i.v.m Lambda en de p-waarde.
2008-12-07 21:45:42 [Ellen Van den Broeck] [reply
goed antwoord
2008-12-14 14:47:49 [Steven Vanhooreweghe] [reply
De interpretatie van de tabellen is goed. Alleen wordt er niets gezegd over de scatterplot, om te kijken of er wel degelijk een verband is, en of dus wel nodig is om lambda te zoeken. Uit de tabel kan je opmaken dat er een verband is.
2008-12-15 13:42:08 [Katja van Hek] [reply
De p-value is in beide gevallen kleiner dan 5% dus de lambda is correct en heeft dus een waarde van -0.52. Er zijn niet veel waarnemingen gedaan maar met je kunt toch een vaag relatief positief patroon zien.

Post a new message
Dataseries X:
5.1
4.9
5.2
5.1
4.6
3.7
3.9
3.1
2.8
2.6
2.2
1.8
1.3
1.2
1.4
1.3
1.3
1.9
1.9
2.1
2.0
1.9
1.9
1.9
1.8
1.7
1.6
1.7
1.9
1.7
1.3
2.0
2.0
2.3
2.0
1.7
2.3
2.4
2.4
2.3
2.1
2.1
2.5
2.0
1.8
1.7
1.9
2.1
1.4
1.6
1.7
1.6
1.9
1.6
1.1
1.3
1.6
1.6
1.7
1.6
1.7
1.6
1.5
1.6
1.1
1.5
1.4
1.3
0.9
1.2
0.9
1.1
1.3
1.3
1.4
1.2
1.7
2.0
3.0
3.1
3.2
2.7
2.8
3.0
2.8
3.1
3.1
3.2
3.1
2.7
2.2
2.2
2.1
2.3
2.5
2.3
2.6


Summary of computational transaction
Raw Inputview raw input (R code)
Raw Outputview raw output of R engine
Computing time1 seconds
R Server'Gwilym Jenkins' @ 72.249.127.135

\begin{tabular}{lllllllll}
\hline
Summary of computational transaction \tabularnewline
Raw Input & view raw input (R code)  \tabularnewline
Raw Output & view raw output of R engine  \tabularnewline
Computing time & 1 seconds \tabularnewline
R Server & 'Gwilym Jenkins' @ 72.249.127.135 \tabularnewline
\hline
\end{tabular}
%Source: https://freestatistics.org/blog/index.php?pk=27746&T=0

[TABLE]
[ROW][C]Summary of computational transaction[/C][/ROW]
[ROW][C]Raw Input[/C][C]view raw input (R code) [/C][/ROW]
[ROW][C]Raw Output[/C][C]view raw output of R engine [/C][/ROW]
[ROW][C]Computing time[/C][C]1 seconds[/C][/ROW]
[ROW][C]R Server[/C][C]'Gwilym Jenkins' @ 72.249.127.135[/C][/ROW]
[/TABLE]
Source: https://freestatistics.org/blog/index.php?pk=27746&T=0

Globally Unique Identifier (entire table): ba.freestatistics.org/blog/index.php?pk=27746&T=0

As an alternative you can also use a QR Code:  

The GUIDs for individual cells are displayed in the table below:

Summary of computational transaction
Raw Inputview raw input (R code)
Raw Outputview raw output of R engine
Computing time1 seconds
R Server'Gwilym Jenkins' @ 72.249.127.135


Standard Deviation-Mean Plot
SectionMeanStandard DeviationRange
13.751.231037995130353.4
21.6750.338781238076620.9
31.808333333333330.2539088359425421
42.133333333333330.2534608929251690.8
51.558333333333330.2065224325624580.8
61.316666666666670.2757908737804900.8
72.2250.8114241128467232
82.633333333333330.4163331998932271.1

\begin{tabular}{lllllllll}
\hline
Standard Deviation-Mean Plot \tabularnewline
Section & Mean & Standard Deviation & Range \tabularnewline
1 & 3.75 & 1.23103799513035 & 3.4 \tabularnewline
2 & 1.675 & 0.33878123807662 & 0.9 \tabularnewline
3 & 1.80833333333333 & 0.253908835942542 & 1 \tabularnewline
4 & 2.13333333333333 & 0.253460892925169 & 0.8 \tabularnewline
5 & 1.55833333333333 & 0.206522432562458 & 0.8 \tabularnewline
6 & 1.31666666666667 & 0.275790873780490 & 0.8 \tabularnewline
7 & 2.225 & 0.811424112846723 & 2 \tabularnewline
8 & 2.63333333333333 & 0.416333199893227 & 1.1 \tabularnewline
\hline
\end{tabular}
%Source: https://freestatistics.org/blog/index.php?pk=27746&T=1

[TABLE]
[ROW][C]Standard Deviation-Mean Plot[/C][/ROW]
[ROW][C]Section[/C][C]Mean[/C][C]Standard Deviation[/C][C]Range[/C][/ROW]
[ROW][C]1[/C][C]3.75[/C][C]1.23103799513035[/C][C]3.4[/C][/ROW]
[ROW][C]2[/C][C]1.675[/C][C]0.33878123807662[/C][C]0.9[/C][/ROW]
[ROW][C]3[/C][C]1.80833333333333[/C][C]0.253908835942542[/C][C]1[/C][/ROW]
[ROW][C]4[/C][C]2.13333333333333[/C][C]0.253460892925169[/C][C]0.8[/C][/ROW]
[ROW][C]5[/C][C]1.55833333333333[/C][C]0.206522432562458[/C][C]0.8[/C][/ROW]
[ROW][C]6[/C][C]1.31666666666667[/C][C]0.275790873780490[/C][C]0.8[/C][/ROW]
[ROW][C]7[/C][C]2.225[/C][C]0.811424112846723[/C][C]2[/C][/ROW]
[ROW][C]8[/C][C]2.63333333333333[/C][C]0.416333199893227[/C][C]1.1[/C][/ROW]
[/TABLE]
Source: https://freestatistics.org/blog/index.php?pk=27746&T=1

Globally Unique Identifier (entire table): ba.freestatistics.org/blog/index.php?pk=27746&T=1

As an alternative you can also use a QR Code:  

The GUIDs for individual cells are displayed in the table below:

Standard Deviation-Mean Plot
SectionMeanStandard DeviationRange
13.751.231037995130353.4
21.6750.338781238076620.9
31.808333333333330.2539088359425421
42.133333333333330.2534608929251690.8
51.558333333333330.2065224325624580.8
61.316666666666670.2757908737804900.8
72.2250.8114241128467232
82.633333333333330.4163331998932271.1


Regression: S.E.(k) = alpha + beta * Mean(k)
alpha-0.382161876546515
beta0.400266350498813
S.D.0.0989701238459663
T-STAT4.04431494015076
p-value0.00676955103691131

\begin{tabular}{lllllllll}
\hline
Regression: S.E.(k) = alpha + beta * Mean(k) \tabularnewline
alpha & -0.382161876546515 \tabularnewline
beta & 0.400266350498813 \tabularnewline
S.D. & 0.0989701238459663 \tabularnewline
T-STAT & 4.04431494015076 \tabularnewline
p-value & 0.00676955103691131 \tabularnewline
\hline
\end{tabular}
%Source: https://freestatistics.org/blog/index.php?pk=27746&T=2

[TABLE]
[ROW][C]Regression: S.E.(k) = alpha + beta * Mean(k)[/C][/ROW]
[ROW][C]alpha[/C][C]-0.382161876546515[/C][/ROW]
[ROW][C]beta[/C][C]0.400266350498813[/C][/ROW]
[ROW][C]S.D.[/C][C]0.0989701238459663[/C][/ROW]
[ROW][C]T-STAT[/C][C]4.04431494015076[/C][/ROW]
[ROW][C]p-value[/C][C]0.00676955103691131[/C][/ROW]
[/TABLE]
Source: https://freestatistics.org/blog/index.php?pk=27746&T=2

Globally Unique Identifier (entire table): ba.freestatistics.org/blog/index.php?pk=27746&T=2

As an alternative you can also use a QR Code:  

The GUIDs for individual cells are displayed in the table below:

Regression: S.E.(k) = alpha + beta * Mean(k)
alpha-0.382161876546515
beta0.400266350498813
S.D.0.0989701238459663
T-STAT4.04431494015076
p-value0.00676955103691131


Regression: ln S.E.(k) = alpha + beta * ln Mean(k)
alpha-2.02745785308628
beta1.52458765280609
S.D.0.468066679595465
T-STAT3.25720184595011
p-value0.0173093739387254
Lambda-0.524587652806088

\begin{tabular}{lllllllll}
\hline
Regression: ln S.E.(k) = alpha + beta * ln Mean(k) \tabularnewline
alpha & -2.02745785308628 \tabularnewline
beta & 1.52458765280609 \tabularnewline
S.D. & 0.468066679595465 \tabularnewline
T-STAT & 3.25720184595011 \tabularnewline
p-value & 0.0173093739387254 \tabularnewline
Lambda & -0.524587652806088 \tabularnewline
\hline
\end{tabular}
%Source: https://freestatistics.org/blog/index.php?pk=27746&T=3

[TABLE]
[ROW][C]Regression: ln S.E.(k) = alpha + beta * ln Mean(k)[/C][/ROW]
[ROW][C]alpha[/C][C]-2.02745785308628[/C][/ROW]
[ROW][C]beta[/C][C]1.52458765280609[/C][/ROW]
[ROW][C]S.D.[/C][C]0.468066679595465[/C][/ROW]
[ROW][C]T-STAT[/C][C]3.25720184595011[/C][/ROW]
[ROW][C]p-value[/C][C]0.0173093739387254[/C][/ROW]
[ROW][C]Lambda[/C][C]-0.524587652806088[/C][/ROW]
[/TABLE]
Source: https://freestatistics.org/blog/index.php?pk=27746&T=3

Globally Unique Identifier (entire table): ba.freestatistics.org/blog/index.php?pk=27746&T=3

As an alternative you can also use a QR Code:  

The GUIDs for individual cells are displayed in the table below:

Regression: ln S.E.(k) = alpha + beta * ln Mean(k)
alpha-2.02745785308628
beta1.52458765280609
S.D.0.468066679595465
T-STAT3.25720184595011
p-value0.0173093739387254
Lambda-0.524587652806088


Parameters (Session):
par1 = 12 ;
Parameters (R input):
par1 = 12 ;
R code (references can be found in the software module):
par1 <- as.numeric(par1)
(n <- length(x))
(np <- floor(n / par1))
arr <- array(NA,dim=c(par1,np))
j <- 0
k <- 1
for (i in 1:(np*par1))
{
j = j + 1
arr[j,k] <- x[i]
if (j == par1) {
j = 0
k=k+1
}
}
arr
arr.mean <- array(NA,dim=np)
arr.sd <- array(NA,dim=np)
arr.range <- array(NA,dim=np)
for (j in 1:np)
{
arr.mean[j] <- mean(arr[,j],na.rm=TRUE)
arr.sd[j] <- sd(arr[,j],na.rm=TRUE)
arr.range[j] <- max(arr[,j],na.rm=TRUE) - min(arr[,j],na.rm=TRUE)
}
arr.mean
arr.sd
arr.range
(lm1 <- lm(arr.sd~arr.mean))
(lnlm1 <- lm(log(arr.sd)~log(arr.mean)))
(lm2 <- lm(arr.range~arr.mean))
bitmap(file='test1.png')
plot(arr.mean,arr.sd,main='Standard Deviation-Mean Plot',xlab='mean',ylab='standard deviation')
dev.off()
bitmap(file='test2.png')
plot(arr.mean,arr.range,main='Range-Mean Plot',xlab='mean',ylab='range')
dev.off()
load(file='createtable')
a<-table.start()
a<-table.row.start(a)
a<-table.element(a,'Standard Deviation-Mean Plot',4,TRUE)
a<-table.row.end(a)
a<-table.row.start(a)
a<-table.element(a,'Section',header=TRUE)
a<-table.element(a,'Mean',header=TRUE)
a<-table.element(a,'Standard Deviation',header=TRUE)
a<-table.element(a,'Range',header=TRUE)
a<-table.row.end(a)
for (j in 1:np) {
a<-table.row.start(a)
a<-table.element(a,j,header=TRUE)
a<-table.element(a,arr.mean[j])
a<-table.element(a,arr.sd[j] )
a<-table.element(a,arr.range[j] )
a<-table.row.end(a)
}
a<-table.end(a)
table.save(a,file='mytable.tab')
a<-table.start()
a<-table.row.start(a)
a<-table.element(a,'Regression: S.E.(k) = alpha + beta * Mean(k)',2,TRUE)
a<-table.row.end(a)
a<-table.row.start(a)
a<-table.element(a,'alpha',header=TRUE)
a<-table.element(a,lm1$coefficients[[1]])
a<-table.row.end(a)
a<-table.row.start(a)
a<-table.element(a,'beta',header=TRUE)
a<-table.element(a,lm1$coefficients[[2]])
a<-table.row.end(a)
a<-table.row.start(a)
a<-table.element(a,'S.D.',header=TRUE)
a<-table.element(a,summary(lm1)$coefficients[2,2])
a<-table.row.end(a)
a<-table.row.start(a)
a<-table.element(a,'T-STAT',header=TRUE)
a<-table.element(a,summary(lm1)$coefficients[2,3])
a<-table.row.end(a)
a<-table.row.start(a)
a<-table.element(a,'p-value',header=TRUE)
a<-table.element(a,summary(lm1)$coefficients[2,4])
a<-table.row.end(a)
a<-table.end(a)
table.save(a,file='mytable1.tab')
a<-table.start()
a<-table.row.start(a)
a<-table.element(a,'Regression: ln S.E.(k) = alpha + beta * ln Mean(k)',2,TRUE)
a<-table.row.end(a)
a<-table.row.start(a)
a<-table.element(a,'alpha',header=TRUE)
a<-table.element(a,lnlm1$coefficients[[1]])
a<-table.row.end(a)
a<-table.row.start(a)
a<-table.element(a,'beta',header=TRUE)
a<-table.element(a,lnlm1$coefficients[[2]])
a<-table.row.end(a)
a<-table.row.start(a)
a<-table.element(a,'S.D.',header=TRUE)
a<-table.element(a,summary(lnlm1)$coefficients[2,2])
a<-table.row.end(a)
a<-table.row.start(a)
a<-table.element(a,'T-STAT',header=TRUE)
a<-table.element(a,summary(lnlm1)$coefficients[2,3])
a<-table.row.end(a)
a<-table.row.start(a)
a<-table.element(a,'p-value',header=TRUE)
a<-table.element(a,summary(lnlm1)$coefficients[2,4])
a<-table.row.end(a)
a<-table.row.start(a)
a<-table.element(a,'Lambda',header=TRUE)
a<-table.element(a,1-lnlm1$coefficients[[2]])
a<-table.row.end(a)
a<-table.end(a)
table.save(a,file='mytable2.tab')