Free Statistics

of Irreproducible Research!

Author's title

Author*The author of this computation has been verified*
R Software Modulerwasp_cross.wasp
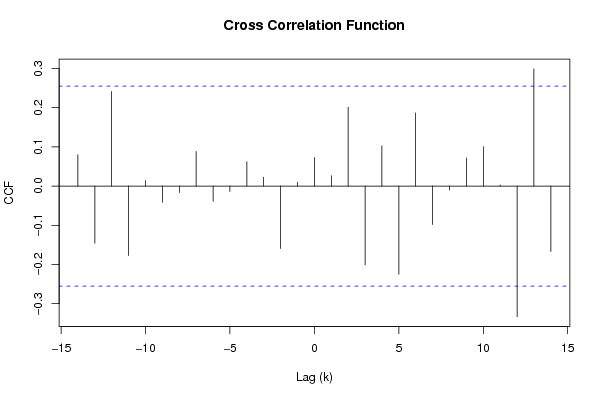
Title produced by softwareCross Correlation Function
Date of computationMon, 01 Dec 2008 16:43:27 -0700
Cite this page as followsStatistical Computations at FreeStatistics.org, Office for Research Development and Education, URL https://freestatistics.org/blog/index.php?v=date/2008/Dec/02/t1228175040xob6eab4h160ods.htm/, Retrieved Fri, 17 May 2024 05:44:29 +0000
Statistical Computations at FreeStatistics.org, Office for Research Development and Education, URL https://freestatistics.org/blog/index.php?pk=27538, Retrieved Fri, 17 May 2024 05:44:29 +0000
QR Codes:

Original text written by user:
IsPrivate?No (this computation is public)
User-defined keywords
Estimated Impact217
Family? (F = Feedback message, R = changed R code, M = changed R Module, P = changed Parameters, D = changed Data)
F     [Cross Correlation Function] [] [2008-12-01 22:15:59] [cf9c64468d04c2c4dd548cc66b4e3677]
F       [Cross Correlation Function] [Q8] [2008-12-01 22:44:55] [6816386b1f3c2f6c0c9f2aa1e5bc9362]
F           [Cross Correlation Function] [Q8] [2008-12-01 23:43:27] [e81ac192d6ae6d77191d83851a692999] [Current]
Feedback Forum
2008-12-08 01:12:05 [Gregory Van Overmeiren] [reply
Door d nu in te stellen op 1, bekomen we een grafiek met transformatie. Xt en Yt is maw 1 keer gedifferentieerd. Hierdoor zijn onze tijdreeksen inderdaad stationair geworden en werd de trend die erin zat dus verwijderd. Het resultaat is nu veel betrouwbaarder.

Post a new message
Dataseries X:
110.4
112.9
109.4
111.9
108.9
113.8
114.5
113.2
111
114.6
113.1
113.2
115.1
117.6
117.8
115.7
115.7
118.3
117.9
117.3
119.4
117.1
119
120
118.9
116
115.6
119.7
119.7
120.8
120
120.2
121.7
116.9
122.4
122.6
123.7
120.9
124.2
122.6
125.7
123.1
122.2
126.2
124.4
127.8
124.2
126.7
126.1
128.2
130.4
130.2
129.2
129.7
131
129.2
131.1
132.9
135.2
132.3
Dataseries Y:
92.1
88.5
84.6
87
83.6
84.8
84.1
84.1
80.5
82.6
85.6
83.3
86.1
84.7
85.7
84.9
84.2
85.2
86.1
86
84.5
87.2
83.5
81.9
78.5
81.1
79.2
80.9
81.8
79.4
83.4
81.1
79.8
79.7
84
83.7
83.5
83.6
86
86.8
86.9
89
87.8
86.8
88.8
85.9
86.7
87.9
88.5
88.7
88.1
85.7
86.1
85.7
84.3
86.4
85.4
86.9
85.6
86.4


Summary of computational transaction
Raw Inputview raw input (R code)
Raw Outputview raw output of R engine
Computing time1 seconds
R Server'Sir Ronald Aylmer Fisher' @ 193.190.124.24

\begin{tabular}{lllllllll}
\hline
Summary of computational transaction \tabularnewline
Raw Input & view raw input (R code)  \tabularnewline
Raw Output & view raw output of R engine  \tabularnewline
Computing time & 1 seconds \tabularnewline
R Server & 'Sir Ronald Aylmer Fisher' @ 193.190.124.24 \tabularnewline
\hline
\end{tabular}
%Source: https://freestatistics.org/blog/index.php?pk=27538&T=0

[TABLE]
[ROW][C]Summary of computational transaction[/C][/ROW]
[ROW][C]Raw Input[/C][C]view raw input (R code) [/C][/ROW]
[ROW][C]Raw Output[/C][C]view raw output of R engine [/C][/ROW]
[ROW][C]Computing time[/C][C]1 seconds[/C][/ROW]
[ROW][C]R Server[/C][C]'Sir Ronald Aylmer Fisher' @ 193.190.124.24[/C][/ROW]
[/TABLE]
Source: https://freestatistics.org/blog/index.php?pk=27538&T=0

Globally Unique Identifier (entire table): ba.freestatistics.org/blog/index.php?pk=27538&T=0

As an alternative you can also use a QR Code:  

The GUIDs for individual cells are displayed in the table below:

Summary of computational transaction
Raw Inputview raw input (R code)
Raw Outputview raw output of R engine
Computing time1 seconds
R Server'Sir Ronald Aylmer Fisher' @ 193.190.124.24


Cross Correlation Function
ParameterValue
Box-Cox transformation parameter (lambda) of X series1
Degree of non-seasonal differencing (d) of X series1
Degree of seasonal differencing (D) of X series0
Seasonal Period (s)1
Box-Cox transformation parameter (lambda) of Y series1
Degree of non-seasonal differencing (d) of Y series1
Degree of seasonal differencing (D) of Y series0
krho(Y[t],X[t+k])
-140.0798177879383704
-13-0.146109506534361
-120.241256363802354
-11-0.177100946045167
-100.0141009004271898
-9-0.0410826119563483
-8-0.0162491899788844
-70.0881146043945446
-6-0.0388938409006965
-5-0.0136447753688218
-40.0620155631586783
-30.0227560090274493
-2-0.159320890454704
-10.0098074465418917
00.0731532655766998
10.0265497415845630
20.200908251263996
3-0.201024260613953
40.102654895852775
5-0.224941554695707
60.186449717183490
7-0.0979549545704285
8-0.0100984053917686
90.0718651322053306
100.100492474880128
110.00287517974301729
12-0.333005774529478
130.298732699235309
14-0.166790809740515

\begin{tabular}{lllllllll}
\hline
Cross Correlation Function \tabularnewline
Parameter & Value \tabularnewline
Box-Cox transformation parameter (lambda) of X series & 1 \tabularnewline
Degree of non-seasonal differencing (d) of X series & 1 \tabularnewline
Degree of seasonal differencing (D) of X series & 0 \tabularnewline
Seasonal Period (s) & 1 \tabularnewline
Box-Cox transformation parameter (lambda) of Y series & 1 \tabularnewline
Degree of non-seasonal differencing (d) of Y series & 1 \tabularnewline
Degree of seasonal differencing (D) of Y series & 0 \tabularnewline
k & rho(Y[t],X[t+k]) \tabularnewline
-14 & 0.0798177879383704 \tabularnewline
-13 & -0.146109506534361 \tabularnewline
-12 & 0.241256363802354 \tabularnewline
-11 & -0.177100946045167 \tabularnewline
-10 & 0.0141009004271898 \tabularnewline
-9 & -0.0410826119563483 \tabularnewline
-8 & -0.0162491899788844 \tabularnewline
-7 & 0.0881146043945446 \tabularnewline
-6 & -0.0388938409006965 \tabularnewline
-5 & -0.0136447753688218 \tabularnewline
-4 & 0.0620155631586783 \tabularnewline
-3 & 0.0227560090274493 \tabularnewline
-2 & -0.159320890454704 \tabularnewline
-1 & 0.0098074465418917 \tabularnewline
0 & 0.0731532655766998 \tabularnewline
1 & 0.0265497415845630 \tabularnewline
2 & 0.200908251263996 \tabularnewline
3 & -0.201024260613953 \tabularnewline
4 & 0.102654895852775 \tabularnewline
5 & -0.224941554695707 \tabularnewline
6 & 0.186449717183490 \tabularnewline
7 & -0.0979549545704285 \tabularnewline
8 & -0.0100984053917686 \tabularnewline
9 & 0.0718651322053306 \tabularnewline
10 & 0.100492474880128 \tabularnewline
11 & 0.00287517974301729 \tabularnewline
12 & -0.333005774529478 \tabularnewline
13 & 0.298732699235309 \tabularnewline
14 & -0.166790809740515 \tabularnewline
\hline
\end{tabular}
%Source: https://freestatistics.org/blog/index.php?pk=27538&T=1

[TABLE]
[ROW][C]Cross Correlation Function[/C][/ROW]
[ROW][C]Parameter[/C][C]Value[/C][/ROW]
[ROW][C]Box-Cox transformation parameter (lambda) of X series[/C][C]1[/C][/ROW]
[ROW][C]Degree of non-seasonal differencing (d) of X series[/C][C]1[/C][/ROW]
[ROW][C]Degree of seasonal differencing (D) of X series[/C][C]0[/C][/ROW]
[ROW][C]Seasonal Period (s)[/C][C]1[/C][/ROW]
[ROW][C]Box-Cox transformation parameter (lambda) of Y series[/C][C]1[/C][/ROW]
[ROW][C]Degree of non-seasonal differencing (d) of Y series[/C][C]1[/C][/ROW]
[ROW][C]Degree of seasonal differencing (D) of Y series[/C][C]0[/C][/ROW]
[ROW][C]k[/C][C]rho(Y[t],X[t+k])[/C][/ROW]
[ROW][C]-14[/C][C]0.0798177879383704[/C][/ROW]
[ROW][C]-13[/C][C]-0.146109506534361[/C][/ROW]
[ROW][C]-12[/C][C]0.241256363802354[/C][/ROW]
[ROW][C]-11[/C][C]-0.177100946045167[/C][/ROW]
[ROW][C]-10[/C][C]0.0141009004271898[/C][/ROW]
[ROW][C]-9[/C][C]-0.0410826119563483[/C][/ROW]
[ROW][C]-8[/C][C]-0.0162491899788844[/C][/ROW]
[ROW][C]-7[/C][C]0.0881146043945446[/C][/ROW]
[ROW][C]-6[/C][C]-0.0388938409006965[/C][/ROW]
[ROW][C]-5[/C][C]-0.0136447753688218[/C][/ROW]
[ROW][C]-4[/C][C]0.0620155631586783[/C][/ROW]
[ROW][C]-3[/C][C]0.0227560090274493[/C][/ROW]
[ROW][C]-2[/C][C]-0.159320890454704[/C][/ROW]
[ROW][C]-1[/C][C]0.0098074465418917[/C][/ROW]
[ROW][C]0[/C][C]0.0731532655766998[/C][/ROW]
[ROW][C]1[/C][C]0.0265497415845630[/C][/ROW]
[ROW][C]2[/C][C]0.200908251263996[/C][/ROW]
[ROW][C]3[/C][C]-0.201024260613953[/C][/ROW]
[ROW][C]4[/C][C]0.102654895852775[/C][/ROW]
[ROW][C]5[/C][C]-0.224941554695707[/C][/ROW]
[ROW][C]6[/C][C]0.186449717183490[/C][/ROW]
[ROW][C]7[/C][C]-0.0979549545704285[/C][/ROW]
[ROW][C]8[/C][C]-0.0100984053917686[/C][/ROW]
[ROW][C]9[/C][C]0.0718651322053306[/C][/ROW]
[ROW][C]10[/C][C]0.100492474880128[/C][/ROW]
[ROW][C]11[/C][C]0.00287517974301729[/C][/ROW]
[ROW][C]12[/C][C]-0.333005774529478[/C][/ROW]
[ROW][C]13[/C][C]0.298732699235309[/C][/ROW]
[ROW][C]14[/C][C]-0.166790809740515[/C][/ROW]
[/TABLE]
Source: https://freestatistics.org/blog/index.php?pk=27538&T=1

Globally Unique Identifier (entire table): ba.freestatistics.org/blog/index.php?pk=27538&T=1

As an alternative you can also use a QR Code:  

The GUIDs for individual cells are displayed in the table below:

Cross Correlation Function
ParameterValue
Box-Cox transformation parameter (lambda) of X series1
Degree of non-seasonal differencing (d) of X series1
Degree of seasonal differencing (D) of X series0
Seasonal Period (s)1
Box-Cox transformation parameter (lambda) of Y series1
Degree of non-seasonal differencing (d) of Y series1
Degree of seasonal differencing (D) of Y series0
krho(Y[t],X[t+k])
-140.0798177879383704
-13-0.146109506534361
-120.241256363802354
-11-0.177100946045167
-100.0141009004271898
-9-0.0410826119563483
-8-0.0162491899788844
-70.0881146043945446
-6-0.0388938409006965
-5-0.0136447753688218
-40.0620155631586783
-30.0227560090274493
-2-0.159320890454704
-10.0098074465418917
00.0731532655766998
10.0265497415845630
20.200908251263996
3-0.201024260613953
40.102654895852775
5-0.224941554695707
60.186449717183490
7-0.0979549545704285
8-0.0100984053917686
90.0718651322053306
100.100492474880128
110.00287517974301729
12-0.333005774529478
130.298732699235309
14-0.166790809740515


Parameters (Session):
par1 = 1 ; par2 = 1 ; par3 = 0 ; par4 = 1 ; par5 = 1 ; par6 = 1 ; par7 = 0 ;
Parameters (R input):
par1 = 1 ; par2 = 1 ; par3 = 0 ; par4 = 1 ; par5 = 1 ; par6 = 1 ; par7 = 0 ; par8 = ; par9 = ; par10 = ; par11 = ; par12 = ; par13 = ; par14 = ; par15 = ; par16 = ; par17 = ; par18 = ; par19 = ; par20 = ;
R code (references can be found in the software module):
par1 <- as.numeric(par1)
par2 <- as.numeric(par2)
par3 <- as.numeric(par3)
par4 <- as.numeric(par4)
par5 <- as.numeric(par5)
par6 <- as.numeric(par6)
par7 <- as.numeric(par7)
if (par1 == 0) {
x <- log(x)
} else {
x <- (x ^ par1 - 1) / par1
}
if (par5 == 0) {
y <- log(y)
} else {
y <- (y ^ par5 - 1) / par5
}
if (par2 > 0) x <- diff(x,lag=1,difference=par2)
if (par6 > 0) y <- diff(y,lag=1,difference=par6)
if (par3 > 0) x <- diff(x,lag=par4,difference=par3)
if (par7 > 0) y <- diff(y,lag=par4,difference=par7)
x
y
bitmap(file='test1.png')
(r <- ccf(x,y,main='Cross Correlation Function',ylab='CCF',xlab='Lag (k)'))
dev.off()
load(file='createtable')
a<-table.start()
a<-table.row.start(a)
a<-table.element(a,'Cross Correlation Function',2,TRUE)
a<-table.row.end(a)
a<-table.row.start(a)
a<-table.element(a,'Parameter',header=TRUE)
a<-table.element(a,'Value',header=TRUE)
a<-table.row.end(a)
a<-table.row.start(a)
a<-table.element(a,'Box-Cox transformation parameter (lambda) of X series',header=TRUE)
a<-table.element(a,par1)
a<-table.row.end(a)
a<-table.row.start(a)
a<-table.element(a,'Degree of non-seasonal differencing (d) of X series',header=TRUE)
a<-table.element(a,par2)
a<-table.row.end(a)
a<-table.row.start(a)
a<-table.element(a,'Degree of seasonal differencing (D) of X series',header=TRUE)
a<-table.element(a,par3)
a<-table.row.end(a)
a<-table.row.start(a)
a<-table.element(a,'Seasonal Period (s)',header=TRUE)
a<-table.element(a,par4)
a<-table.row.end(a)
a<-table.row.start(a)
a<-table.element(a,'Box-Cox transformation parameter (lambda) of Y series',header=TRUE)
a<-table.element(a,par5)
a<-table.row.end(a)
a<-table.row.start(a)
a<-table.element(a,'Degree of non-seasonal differencing (d) of Y series',header=TRUE)
a<-table.element(a,par6)
a<-table.row.end(a)
a<-table.row.start(a)
a<-table.element(a,'Degree of seasonal differencing (D) of Y series',header=TRUE)
a<-table.element(a,par7)
a<-table.row.end(a)
a<-table.row.start(a)
a<-table.element(a,'k',header=TRUE)
a<-table.element(a,'rho(Y[t],X[t+k])',header=TRUE)
a<-table.row.end(a)
mylength <- length(r$acf)
myhalf <- floor((mylength-1)/2)
for (i in 1:mylength) {
a<-table.row.start(a)
a<-table.element(a,i-myhalf-1,header=TRUE)
a<-table.element(a,r$acf[i])
a<-table.row.end(a)
}
a<-table.end(a)
table.save(a,file='mytable.tab')