Free Statistics

of Irreproducible Research!

Author's title

Author*The author of this computation has been verified*
R Software Modulerwasp_smp.wasp
Title produced by softwareStandard Deviation-Mean Plot
Date of computationMon, 01 Dec 2008 15:41:40 -0700
Cite this page as followsStatistical Computations at FreeStatistics.org, Office for Research Development and Education, URL https://freestatistics.org/blog/index.php?v=date/2008/Dec/01/t122817135256q6het7truy157.htm/, Retrieved Sun, 05 May 2024 20:00:50 +0000
Statistical Computations at FreeStatistics.org, Office for Research Development and Education, URL https://freestatistics.org/blog/index.php?pk=27478, Retrieved Sun, 05 May 2024 20:00:50 +0000
QR Codes:

Original text written by user:
IsPrivate?No (this computation is public)
User-defined keywordsNon Stationary Time Series
Estimated Impact178
Family? (F = Feedback message, R = changed R code, M = changed R Module, P = changed Parameters, D = changed Data)
-     [Standard Deviation-Mean Plot] [Q8] [2008-11-26 19:34:28] [8eb83367d7ce233bbf617141d324189b]
F         [Standard Deviation-Mean Plot] [question 8 Standa...] [2008-12-01 22:41:40] [3efbb18563b4564408d69b3c9a8e9a6e] [Current]
Feedback Forum
2008-12-08 07:50:27 [0762c65deec3d397cd9f26b3749a0847] [reply
je hebt de technieken goed toegepast. ook een goede conclusie gegevens maar het is puur toeval dat je voor beide reeksen dezelfde resultaten bekomt.
2008-12-09 07:45:10 [An De Koninck] [reply
Het berust inderdaad op toeval dat je hetzelfde resultaat bekomt.
Wel goede berekeningen.

Post a new message
Dataseries X:
3353
3480
3098
2944
3389
3497
4404
3849
3734
3060
3507
3287
3215
3764
2734
2837
2766
3851
3289
3848
3348
3682
4058
3655
3811
3341
3032
3475
3353
3186
3902
4164
3499
4145
3796
3711
3949
3740
3243
4407
4814
3908
5250
3937
4004
5560
3922
3759
4138
4634
3996
4308
4142
4429
5219
4929
5754
5592
4163
4962
5208
4755
4491
5732
5730
5024
6056
4901
5353
5578
4618
4724
5011
5298
4143
4617
4727
4207
5112
4190
4098
5071
4177
4598
3757
5591
4218
3780
4336
4870
4422
4727
4459


Summary of computational transaction
Raw Inputview raw input (R code)
Raw Outputview raw output of R engine
Computing time2 seconds
R Server'Sir Ronald Aylmer Fisher' @ 193.190.124.24

\begin{tabular}{lllllllll}
\hline
Summary of computational transaction \tabularnewline
Raw Input & view raw input (R code)  \tabularnewline
Raw Output & view raw output of R engine  \tabularnewline
Computing time & 2 seconds \tabularnewline
R Server & 'Sir Ronald Aylmer Fisher' @ 193.190.124.24 \tabularnewline
\hline
\end{tabular}
%Source: https://freestatistics.org/blog/index.php?pk=27478&T=0

[TABLE]
[ROW][C]Summary of computational transaction[/C][/ROW]
[ROW][C]Raw Input[/C][C]view raw input (R code) [/C][/ROW]
[ROW][C]Raw Output[/C][C]view raw output of R engine [/C][/ROW]
[ROW][C]Computing time[/C][C]2 seconds[/C][/ROW]
[ROW][C]R Server[/C][C]'Sir Ronald Aylmer Fisher' @ 193.190.124.24[/C][/ROW]
[/TABLE]
Source: https://freestatistics.org/blog/index.php?pk=27478&T=0

Globally Unique Identifier (entire table): ba.freestatistics.org/blog/index.php?pk=27478&T=0

As an alternative you can also use a QR Code:  

The GUIDs for individual cells are displayed in the table below:

Summary of computational transaction
Raw Inputview raw input (R code)
Raw Outputview raw output of R engine
Computing time2 seconds
R Server'Sir Ronald Aylmer Fisher' @ 193.190.124.24


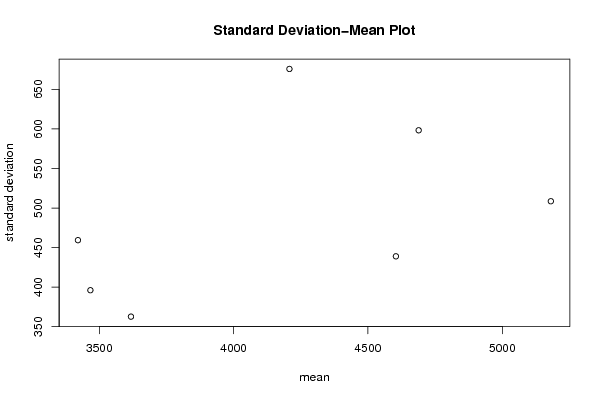
Standard Deviation-Mean Plot
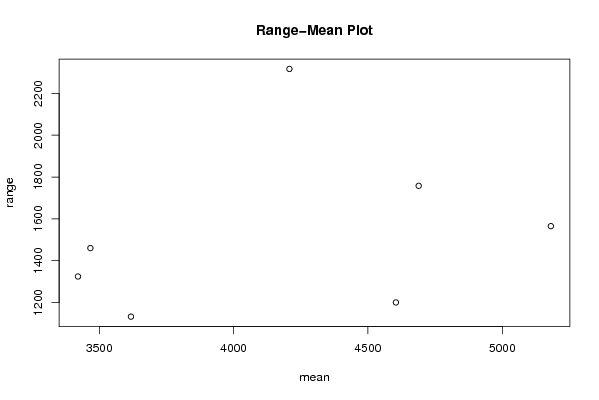
SectionMeanStandard DeviationRange
13466.83333333333395.9648362104291460
23420.58333333333459.3237041036691324
33617.91666666667362.5248476332561132
44207.75675.9698924172182317
54688.83333333333598.3449648569771758
65180.83333333333508.5622931958351565
74604.08333333333438.8686816087131200

\begin{tabular}{lllllllll}
\hline
Standard Deviation-Mean Plot \tabularnewline
Section & Mean & Standard Deviation & Range \tabularnewline
1 & 3466.83333333333 & 395.964836210429 & 1460 \tabularnewline
2 & 3420.58333333333 & 459.323704103669 & 1324 \tabularnewline
3 & 3617.91666666667 & 362.524847633256 & 1132 \tabularnewline
4 & 4207.75 & 675.969892417218 & 2317 \tabularnewline
5 & 4688.83333333333 & 598.344964856977 & 1758 \tabularnewline
6 & 5180.83333333333 & 508.562293195835 & 1565 \tabularnewline
7 & 4604.08333333333 & 438.868681608713 & 1200 \tabularnewline
\hline
\end{tabular}
%Source: https://freestatistics.org/blog/index.php?pk=27478&T=1

[TABLE]
[ROW][C]Standard Deviation-Mean Plot[/C][/ROW]
[ROW][C]Section[/C][C]Mean[/C][C]Standard Deviation[/C][C]Range[/C][/ROW]
[ROW][C]1[/C][C]3466.83333333333[/C][C]395.964836210429[/C][C]1460[/C][/ROW]
[ROW][C]2[/C][C]3420.58333333333[/C][C]459.323704103669[/C][C]1324[/C][/ROW]
[ROW][C]3[/C][C]3617.91666666667[/C][C]362.524847633256[/C][C]1132[/C][/ROW]
[ROW][C]4[/C][C]4207.75[/C][C]675.969892417218[/C][C]2317[/C][/ROW]
[ROW][C]5[/C][C]4688.83333333333[/C][C]598.344964856977[/C][C]1758[/C][/ROW]
[ROW][C]6[/C][C]5180.83333333333[/C][C]508.562293195835[/C][C]1565[/C][/ROW]
[ROW][C]7[/C][C]4604.08333333333[/C][C]438.868681608713[/C][C]1200[/C][/ROW]
[/TABLE]
Source: https://freestatistics.org/blog/index.php?pk=27478&T=1

Globally Unique Identifier (entire table): ba.freestatistics.org/blog/index.php?pk=27478&T=1

As an alternative you can also use a QR Code:  

The GUIDs for individual cells are displayed in the table below:

Standard Deviation-Mean Plot
SectionMeanStandard DeviationRange
13466.83333333333395.9648362104291460
23420.58333333333459.3237041036691324
33617.91666666667362.5248476332561132
44207.75675.9698924172182317
54688.83333333333598.3449648569771758
65180.83333333333508.5622931958351565
74604.08333333333438.8686816087131200


Regression: S.E.(k) = alpha + beta * Mean(k)
alpha169.599696531845
beta0.0771704596582882
S.D.0.0641000346945755
T-STAT1.20390667533943
p-value0.282505976489347

\begin{tabular}{lllllllll}
\hline
Regression: S.E.(k) = alpha + beta * Mean(k) \tabularnewline
alpha & 169.599696531845 \tabularnewline
beta & 0.0771704596582882 \tabularnewline
S.D. & 0.0641000346945755 \tabularnewline
T-STAT & 1.20390667533943 \tabularnewline
p-value & 0.282505976489347 \tabularnewline
\hline
\end{tabular}
%Source: https://freestatistics.org/blog/index.php?pk=27478&T=2

[TABLE]
[ROW][C]Regression: S.E.(k) = alpha + beta * Mean(k)[/C][/ROW]
[ROW][C]alpha[/C][C]169.599696531845[/C][/ROW]
[ROW][C]beta[/C][C]0.0771704596582882[/C][/ROW]
[ROW][C]S.D.[/C][C]0.0641000346945755[/C][/ROW]
[ROW][C]T-STAT[/C][C]1.20390667533943[/C][/ROW]
[ROW][C]p-value[/C][C]0.282505976489347[/C][/ROW]
[/TABLE]
Source: https://freestatistics.org/blog/index.php?pk=27478&T=2

Globally Unique Identifier (entire table): ba.freestatistics.org/blog/index.php?pk=27478&T=2

As an alternative you can also use a QR Code:  

The GUIDs for individual cells are displayed in the table below:

Regression: S.E.(k) = alpha + beta * Mean(k)
alpha169.599696531845
beta0.0771704596582882
S.D.0.0641000346945755
T-STAT1.20390667533943
p-value0.282505976489347


Regression: ln S.E.(k) = alpha + beta * ln Mean(k)
alpha0.217240027260564
beta0.715832490241344
S.D.0.508607271214527
T-STAT1.40743660335798
p-value0.218320004365828
Lambda0.284167509758656

\begin{tabular}{lllllllll}
\hline
Regression: ln S.E.(k) = alpha + beta * ln Mean(k) \tabularnewline
alpha & 0.217240027260564 \tabularnewline
beta & 0.715832490241344 \tabularnewline
S.D. & 0.508607271214527 \tabularnewline
T-STAT & 1.40743660335798 \tabularnewline
p-value & 0.218320004365828 \tabularnewline
Lambda & 0.284167509758656 \tabularnewline
\hline
\end{tabular}
%Source: https://freestatistics.org/blog/index.php?pk=27478&T=3

[TABLE]
[ROW][C]Regression: ln S.E.(k) = alpha + beta * ln Mean(k)[/C][/ROW]
[ROW][C]alpha[/C][C]0.217240027260564[/C][/ROW]
[ROW][C]beta[/C][C]0.715832490241344[/C][/ROW]
[ROW][C]S.D.[/C][C]0.508607271214527[/C][/ROW]
[ROW][C]T-STAT[/C][C]1.40743660335798[/C][/ROW]
[ROW][C]p-value[/C][C]0.218320004365828[/C][/ROW]
[ROW][C]Lambda[/C][C]0.284167509758656[/C][/ROW]
[/TABLE]
Source: https://freestatistics.org/blog/index.php?pk=27478&T=3

Globally Unique Identifier (entire table): ba.freestatistics.org/blog/index.php?pk=27478&T=3

As an alternative you can also use a QR Code:  

The GUIDs for individual cells are displayed in the table below:

Regression: ln S.E.(k) = alpha + beta * ln Mean(k)
alpha0.217240027260564
beta0.715832490241344
S.D.0.508607271214527
T-STAT1.40743660335798
p-value0.218320004365828
Lambda0.284167509758656


Parameters (Session):
par1 = 12 ;
Parameters (R input):
par1 = 12 ; par2 = ; par3 = ; par4 = ; par5 = ; par6 = ; par7 = ; par8 = ; par9 = ; par10 = ; par11 = ; par12 = ; par13 = ; par14 = ; par15 = ; par16 = ; par17 = ; par18 = ; par19 = ; par20 = ;
R code (references can be found in the software module):
par1 <- as.numeric(par1)
(n <- length(x))
(np <- floor(n / par1))
arr <- array(NA,dim=c(par1,np))
j <- 0
k <- 1
for (i in 1:(np*par1))
{
j = j + 1
arr[j,k] <- x[i]
if (j == par1) {
j = 0
k=k+1
}
}
arr
arr.mean <- array(NA,dim=np)
arr.sd <- array(NA,dim=np)
arr.range <- array(NA,dim=np)
for (j in 1:np)
{
arr.mean[j] <- mean(arr[,j],na.rm=TRUE)
arr.sd[j] <- sd(arr[,j],na.rm=TRUE)
arr.range[j] <- max(arr[,j],na.rm=TRUE) - min(arr[,j],na.rm=TRUE)
}
arr.mean
arr.sd
arr.range
(lm1 <- lm(arr.sd~arr.mean))
(lnlm1 <- lm(log(arr.sd)~log(arr.mean)))
(lm2 <- lm(arr.range~arr.mean))
bitmap(file='test1.png')
plot(arr.mean,arr.sd,main='Standard Deviation-Mean Plot',xlab='mean',ylab='standard deviation')
dev.off()
bitmap(file='test2.png')
plot(arr.mean,arr.range,main='Range-Mean Plot',xlab='mean',ylab='range')
dev.off()
load(file='createtable')
a<-table.start()
a<-table.row.start(a)
a<-table.element(a,'Standard Deviation-Mean Plot',4,TRUE)
a<-table.row.end(a)
a<-table.row.start(a)
a<-table.element(a,'Section',header=TRUE)
a<-table.element(a,'Mean',header=TRUE)
a<-table.element(a,'Standard Deviation',header=TRUE)
a<-table.element(a,'Range',header=TRUE)
a<-table.row.end(a)
for (j in 1:np) {
a<-table.row.start(a)
a<-table.element(a,j,header=TRUE)
a<-table.element(a,arr.mean[j])
a<-table.element(a,arr.sd[j] )
a<-table.element(a,arr.range[j] )
a<-table.row.end(a)
}
a<-table.end(a)
table.save(a,file='mytable.tab')
a<-table.start()
a<-table.row.start(a)
a<-table.element(a,'Regression: S.E.(k) = alpha + beta * Mean(k)',2,TRUE)
a<-table.row.end(a)
a<-table.row.start(a)
a<-table.element(a,'alpha',header=TRUE)
a<-table.element(a,lm1$coefficients[[1]])
a<-table.row.end(a)
a<-table.row.start(a)
a<-table.element(a,'beta',header=TRUE)
a<-table.element(a,lm1$coefficients[[2]])
a<-table.row.end(a)
a<-table.row.start(a)
a<-table.element(a,'S.D.',header=TRUE)
a<-table.element(a,summary(lm1)$coefficients[2,2])
a<-table.row.end(a)
a<-table.row.start(a)
a<-table.element(a,'T-STAT',header=TRUE)
a<-table.element(a,summary(lm1)$coefficients[2,3])
a<-table.row.end(a)
a<-table.row.start(a)
a<-table.element(a,'p-value',header=TRUE)
a<-table.element(a,summary(lm1)$coefficients[2,4])
a<-table.row.end(a)
a<-table.end(a)
table.save(a,file='mytable1.tab')
a<-table.start()
a<-table.row.start(a)
a<-table.element(a,'Regression: ln S.E.(k) = alpha + beta * ln Mean(k)',2,TRUE)
a<-table.row.end(a)
a<-table.row.start(a)
a<-table.element(a,'alpha',header=TRUE)
a<-table.element(a,lnlm1$coefficients[[1]])
a<-table.row.end(a)
a<-table.row.start(a)
a<-table.element(a,'beta',header=TRUE)
a<-table.element(a,lnlm1$coefficients[[2]])
a<-table.row.end(a)
a<-table.row.start(a)
a<-table.element(a,'S.D.',header=TRUE)
a<-table.element(a,summary(lnlm1)$coefficients[2,2])
a<-table.row.end(a)
a<-table.row.start(a)
a<-table.element(a,'T-STAT',header=TRUE)
a<-table.element(a,summary(lnlm1)$coefficients[2,3])
a<-table.row.end(a)
a<-table.row.start(a)
a<-table.element(a,'p-value',header=TRUE)
a<-table.element(a,summary(lnlm1)$coefficients[2,4])
a<-table.row.end(a)
a<-table.row.start(a)
a<-table.element(a,'Lambda',header=TRUE)
a<-table.element(a,1-lnlm1$coefficients[[2]])
a<-table.row.end(a)
a<-table.end(a)
table.save(a,file='mytable2.tab')