Free Statistics

of Irreproducible Research!

Author's title

Author*The author of this computation has been verified*
R Software Modulerwasp_smp.wasp
Title produced by softwareStandard Deviation-Mean Plot
Date of computationMon, 01 Dec 2008 14:13:37 -0700
Cite this page as followsStatistical Computations at FreeStatistics.org, Office for Research Development and Education, URL https://freestatistics.org/blog/index.php?v=date/2008/Dec/01/t1228166129wz3tz21y04k5lkr.htm/, Retrieved Sun, 05 May 2024 12:52:15 +0000
Statistical Computations at FreeStatistics.org, Office for Research Development and Education, URL https://freestatistics.org/blog/index.php?pk=27411, Retrieved Sun, 05 May 2024 12:52:15 +0000
QR Codes:

Original text written by user:
IsPrivate?No (this computation is public)
User-defined keywords
Estimated Impact217
Family? (F = Feedback message, R = changed R code, M = changed R Module, P = changed Parameters, D = changed Data)
F     [Law of Averages] [Random Walk Simul...] [2008-11-25 18:40:39] [b98453cac15ba1066b407e146608df68]
F RMPD    [Standard Deviation-Mean Plot] [Non stationary ti...] [2008-12-01 21:13:37] [c5d6d05aee6be5527ac4a30a8c3b8fe5] [Current]
F RM        [Variance Reduction Matrix] [Non stat time ser...] [2008-12-02 17:48:28] [7849b5cbaea5f05923be73656f726e58]
F RMP       [Spectral Analysis] [Non stat time ser...] [2008-12-02 17:59:13] [7849b5cbaea5f05923be73656f726e58]
F RMP       [Spectral Analysis] [Non stat time ser...] [2008-12-02 18:04:21] [7849b5cbaea5f05923be73656f726e58]
F RMP       [Spectral Analysis] [Non stat time ser...] [2008-12-02 18:07:02] [7849b5cbaea5f05923be73656f726e58]
Feedback Forum
2008-12-06 14:07:12 [Thomas Plasschaert] [reply
de seasonal periods moeten op 12 worden gezet, dit wilt zeggen dat we rekenen over 12 maanden tijd.
de lamba berekenen doen we door de standard deviation plot. deze verdeelt de reeks onder in perioden. in de grafiek zie je punten die de jaren voorstellen.
x-as = het gemiddelde
y-as = standard deviation

Door een lambda toe te voegen kan men de tijdreeks transformeren waardoor de spreiding harder naar een diagonaal zal deinen. Een lambda van 1 geeft bijvoorbeeld een perfecte rechte. De bedoeling van deze transformatie is om de tijdreeks stationair proberen te krijgen. Hier voor moet je zien dat de spreiding gelijk loopt door de tijd en hierdoor wordt de trend eruit gehaald.
de optimale lambda is -0.312592539725757
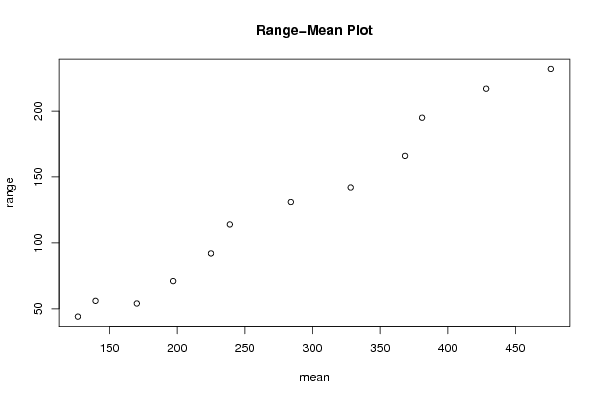
We hebben gezien op de run sequence plot dat er sprake was van heteroskedasticiteit : de variantie werd groter naarmate de tijd vordert. De gegevens in de standard deviation mean plot bevestigden dit. Ook de p value (6.19…e-11) is kleiner dan 0.05 wat de heteroskedasticiteit bevestigt. We gaan de tijdreeks tot de 0.3e macht vereffenen om deze heteroskedastische trend weg te werken.

2008-12-08 13:23:44 [Katja van Hek] [reply
Om een tijdreeks stationair te maken moet je de trend eruit halen en de spreiding doorheen de tijd gelijk maken. Dit doe je door d=1 te stellen en D ook gelijk te stellen aan 1. Hier is het belangrijk dat we lambda vinden. De seizoenale periode zou 12 maanden moeten bedragen. De lambda kun je vinden door gebruik te maken van de standard deviation plot.
2008-12-08 13:24:44 [Katja van Hek] [reply
De lambda zou trouwens -0.312592539725757 moeten zijn om een perfect stationaire tijdreeks te krijgen.
2008-12-08 14:36:15 [Jonas Janssens] [reply
Je hebt de juiste berekeningen uitgevoerd, maar niet de juiste tabel in je document weergegeven en hiermee geen antwoord gegeven op de vraag. Je moet trachten de meest optimale Lambda transformatieparameter te zoeken om de tijdreeks stationair te maken. Hiervoor moest je in de 'Regression: ln S.E.(k) = alpha + beta * ln Mean(k)'-tabel kijken, waarin Lambda gegeven staat. Deze bedraagt -0.3126. Deze Lambda-waarde heb je dus nodig om de tijdreeks stationair te maken in de volgende vragen.
2008-12-08 19:34:55 [5faab2fc6fb120339944528a32d48a04] [reply
De student werkte het goed uit.
De grafiek vertoont een trendmatig verloop, er is sprake van seizoenaliteit en de spreiding is niet constant. Om dit op te lossen moeten we tijdreeks modelleren, proberen stationair te maken of maw de trend eruit halen. Stationair willen zeggen dat het niveau gelijk (horizontaal) wordt en dat de spreiding gelijk wordt.
Je had je reeks ook stationair kunnen maken.
2008-12-09 22:23:48 [Gert-Jan Geudens] [reply
Goede conclusie. De transformatie is hier zeker aan te raden aangezien de p-waarde zeer klein is. We zullen yt tot de -0.3de macht zetten om een goede transformatie toe te passen. Ook uit de standard-deviation mean plot kunnen we afleiden dat we een zonder enige grote moeite een regressierechte kunnen tekenen doorheen de punten. Transformatie is hier dus zeker en vast mogelijk.

Post a new message
Dataseries X:
112
118
132
129
121
135
148
148
136
119
104
118
115
126
141
135
125
149
170
170
158
133
114
140
145
150
178
163
172
178
199
199
184
162
146
166
171
180
193
181
183
218
230
242
209
191
172
194
196
196
236
235
229
243
264
272
237
211
180
201
204
188
235
227
234
264
302
293
259
229
203
229
242
233
267
269
270
315
364
347
312
274
237
278
284
277
317
313
318
374
413
405
355
306
271
306
315
301
356
348
355
422
465
467
404
347
305
336
340
318
362
348
363
435
491
505
404
359
310
337
360
342
406
396
420
472
548
559
463
407
362
405
417
391
419
461
472
535
622
606
508
461
390
432


Summary of computational transaction
Raw Inputview raw input (R code)
Raw Outputview raw output of R engine
Computing time1 seconds
R Server'George Udny Yule' @ 72.249.76.132

\begin{tabular}{lllllllll}
\hline
Summary of computational transaction \tabularnewline
Raw Input & view raw input (R code)  \tabularnewline
Raw Output & view raw output of R engine  \tabularnewline
Computing time & 1 seconds \tabularnewline
R Server & 'George Udny Yule' @ 72.249.76.132 \tabularnewline
\hline
\end{tabular}
%Source: https://freestatistics.org/blog/index.php?pk=27411&T=0

[TABLE]
[ROW][C]Summary of computational transaction[/C][/ROW]
[ROW][C]Raw Input[/C][C]view raw input (R code) [/C][/ROW]
[ROW][C]Raw Output[/C][C]view raw output of R engine [/C][/ROW]
[ROW][C]Computing time[/C][C]1 seconds[/C][/ROW]
[ROW][C]R Server[/C][C]'George Udny Yule' @ 72.249.76.132[/C][/ROW]
[/TABLE]
Source: https://freestatistics.org/blog/index.php?pk=27411&T=0

Globally Unique Identifier (entire table): ba.freestatistics.org/blog/index.php?pk=27411&T=0

As an alternative you can also use a QR Code:  

The GUIDs for individual cells are displayed in the table below:

Summary of computational transaction
Raw Inputview raw input (R code)
Raw Outputview raw output of R engine
Computing time1 seconds
R Server'George Udny Yule' @ 72.249.76.132


Standard Deviation-Mean Plot
SectionMeanStandard DeviationRange
1126.66666666666713.720146655281244
2139.66666666666719.070840823020156
3170.16666666666718.438267189996454
419722.966378588156871
522528.466886664397292
6238.91666666666734.9244856364370114
728442.1404577789347131
8328.2547.8617801591207142
9368.41666666666757.8908979081166
1038164.5304720126997195
11428.33333333333369.8300968368398217
12476.16666666666777.7371250179771232

\begin{tabular}{lllllllll}
\hline
Standard Deviation-Mean Plot \tabularnewline
Section & Mean & Standard Deviation & Range \tabularnewline
1 & 126.666666666667 & 13.7201466552812 & 44 \tabularnewline
2 & 139.666666666667 & 19.0708408230201 & 56 \tabularnewline
3 & 170.166666666667 & 18.4382671899964 & 54 \tabularnewline
4 & 197 & 22.9663785881568 & 71 \tabularnewline
5 & 225 & 28.4668866643972 & 92 \tabularnewline
6 & 238.916666666667 & 34.9244856364370 & 114 \tabularnewline
7 & 284 & 42.1404577789347 & 131 \tabularnewline
8 & 328.25 & 47.8617801591207 & 142 \tabularnewline
9 & 368.416666666667 & 57.8908979081 & 166 \tabularnewline
10 & 381 & 64.5304720126997 & 195 \tabularnewline
11 & 428.333333333333 & 69.8300968368398 & 217 \tabularnewline
12 & 476.166666666667 & 77.7371250179771 & 232 \tabularnewline
\hline
\end{tabular}
%Source: https://freestatistics.org/blog/index.php?pk=27411&T=1

[TABLE]
[ROW][C]Standard Deviation-Mean Plot[/C][/ROW]
[ROW][C]Section[/C][C]Mean[/C][C]Standard Deviation[/C][C]Range[/C][/ROW]
[ROW][C]1[/C][C]126.666666666667[/C][C]13.7201466552812[/C][C]44[/C][/ROW]
[ROW][C]2[/C][C]139.666666666667[/C][C]19.0708408230201[/C][C]56[/C][/ROW]
[ROW][C]3[/C][C]170.166666666667[/C][C]18.4382671899964[/C][C]54[/C][/ROW]
[ROW][C]4[/C][C]197[/C][C]22.9663785881568[/C][C]71[/C][/ROW]
[ROW][C]5[/C][C]225[/C][C]28.4668866643972[/C][C]92[/C][/ROW]
[ROW][C]6[/C][C]238.916666666667[/C][C]34.9244856364370[/C][C]114[/C][/ROW]
[ROW][C]7[/C][C]284[/C][C]42.1404577789347[/C][C]131[/C][/ROW]
[ROW][C]8[/C][C]328.25[/C][C]47.8617801591207[/C][C]142[/C][/ROW]
[ROW][C]9[/C][C]368.416666666667[/C][C]57.8908979081[/C][C]166[/C][/ROW]
[ROW][C]10[/C][C]381[/C][C]64.5304720126997[/C][C]195[/C][/ROW]
[ROW][C]11[/C][C]428.333333333333[/C][C]69.8300968368398[/C][C]217[/C][/ROW]
[ROW][C]12[/C][C]476.166666666667[/C][C]77.7371250179771[/C][C]232[/C][/ROW]
[/TABLE]
Source: https://freestatistics.org/blog/index.php?pk=27411&T=1

Globally Unique Identifier (entire table): ba.freestatistics.org/blog/index.php?pk=27411&T=1

As an alternative you can also use a QR Code:  

The GUIDs for individual cells are displayed in the table below:

Standard Deviation-Mean Plot
SectionMeanStandard DeviationRange
1126.66666666666713.720146655281244
2139.66666666666719.070840823020156
3170.16666666666718.438267189996454
419722.966378588156871
522528.466886664397292
6238.91666666666734.9244856364370114
728442.1404577789347131
8328.2547.8617801591207142
9368.41666666666757.8908979081166
1038164.5304720126997195
11428.33333333333369.8300968368398217
12476.16666666666777.7371250179771232


Regression: S.E.(k) = alpha + beta * Mean(k)
alpha-11.4032541425579
beta0.188613398899484
S.D.0.00657733180244678
T-STAT28.6762785525460
p-value6.19171705602778e-11

\begin{tabular}{lllllllll}
\hline
Regression: S.E.(k) = alpha + beta * Mean(k) \tabularnewline
alpha & -11.4032541425579 \tabularnewline
beta & 0.188613398899484 \tabularnewline
S.D. & 0.00657733180244678 \tabularnewline
T-STAT & 28.6762785525460 \tabularnewline
p-value & 6.19171705602778e-11 \tabularnewline
\hline
\end{tabular}
%Source: https://freestatistics.org/blog/index.php?pk=27411&T=2

[TABLE]
[ROW][C]Regression: S.E.(k) = alpha + beta * Mean(k)[/C][/ROW]
[ROW][C]alpha[/C][C]-11.4032541425579[/C][/ROW]
[ROW][C]beta[/C][C]0.188613398899484[/C][/ROW]
[ROW][C]S.D.[/C][C]0.00657733180244678[/C][/ROW]
[ROW][C]T-STAT[/C][C]28.6762785525460[/C][/ROW]
[ROW][C]p-value[/C][C]6.19171705602778e-11[/C][/ROW]
[/TABLE]
Source: https://freestatistics.org/blog/index.php?pk=27411&T=2

Globally Unique Identifier (entire table): ba.freestatistics.org/blog/index.php?pk=27411&T=2

As an alternative you can also use a QR Code:  

The GUIDs for individual cells are displayed in the table below:

Regression: S.E.(k) = alpha + beta * Mean(k)
alpha-11.4032541425579
beta0.188613398899484
S.D.0.00657733180244678
T-STAT28.6762785525460
p-value6.19171705602778e-11


Regression: ln S.E.(k) = alpha + beta * ln Mean(k)
alpha-3.70703989322048
beta1.31259253972576
S.D.0.0574958902763332
T-STAT22.8293280340083
p-value5.8658934502011e-10
Lambda-0.312592539725757

\begin{tabular}{lllllllll}
\hline
Regression: ln S.E.(k) = alpha + beta * ln Mean(k) \tabularnewline
alpha & -3.70703989322048 \tabularnewline
beta & 1.31259253972576 \tabularnewline
S.D. & 0.0574958902763332 \tabularnewline
T-STAT & 22.8293280340083 \tabularnewline
p-value & 5.8658934502011e-10 \tabularnewline
Lambda & -0.312592539725757 \tabularnewline
\hline
\end{tabular}
%Source: https://freestatistics.org/blog/index.php?pk=27411&T=3

[TABLE]
[ROW][C]Regression: ln S.E.(k) = alpha + beta * ln Mean(k)[/C][/ROW]
[ROW][C]alpha[/C][C]-3.70703989322048[/C][/ROW]
[ROW][C]beta[/C][C]1.31259253972576[/C][/ROW]
[ROW][C]S.D.[/C][C]0.0574958902763332[/C][/ROW]
[ROW][C]T-STAT[/C][C]22.8293280340083[/C][/ROW]
[ROW][C]p-value[/C][C]5.8658934502011e-10[/C][/ROW]
[ROW][C]Lambda[/C][C]-0.312592539725757[/C][/ROW]
[/TABLE]
Source: https://freestatistics.org/blog/index.php?pk=27411&T=3

Globally Unique Identifier (entire table): ba.freestatistics.org/blog/index.php?pk=27411&T=3

As an alternative you can also use a QR Code:  

The GUIDs for individual cells are displayed in the table below:

Regression: ln S.E.(k) = alpha + beta * ln Mean(k)
alpha-3.70703989322048
beta1.31259253972576
S.D.0.0574958902763332
T-STAT22.8293280340083
p-value5.8658934502011e-10
Lambda-0.312592539725757


Parameters (Session):
par1 = 12 ;
Parameters (R input):
par1 = 12 ;
R code (references can be found in the software module):
par1 <- as.numeric(par1)
(n <- length(x))
(np <- floor(n / par1))
arr <- array(NA,dim=c(par1,np))
j <- 0
k <- 1
for (i in 1:(np*par1))
{
j = j + 1
arr[j,k] <- x[i]
if (j == par1) {
j = 0
k=k+1
}
}
arr
arr.mean <- array(NA,dim=np)
arr.sd <- array(NA,dim=np)
arr.range <- array(NA,dim=np)
for (j in 1:np)
{
arr.mean[j] <- mean(arr[,j],na.rm=TRUE)
arr.sd[j] <- sd(arr[,j],na.rm=TRUE)
arr.range[j] <- max(arr[,j],na.rm=TRUE) - min(arr[,j],na.rm=TRUE)
}
arr.mean
arr.sd
arr.range
(lm1 <- lm(arr.sd~arr.mean))
(lnlm1 <- lm(log(arr.sd)~log(arr.mean)))
(lm2 <- lm(arr.range~arr.mean))
bitmap(file='test1.png')
plot(arr.mean,arr.sd,main='Standard Deviation-Mean Plot',xlab='mean',ylab='standard deviation')
dev.off()
bitmap(file='test2.png')
plot(arr.mean,arr.range,main='Range-Mean Plot',xlab='mean',ylab='range')
dev.off()
load(file='createtable')
a<-table.start()
a<-table.row.start(a)
a<-table.element(a,'Standard Deviation-Mean Plot',4,TRUE)
a<-table.row.end(a)
a<-table.row.start(a)
a<-table.element(a,'Section',header=TRUE)
a<-table.element(a,'Mean',header=TRUE)
a<-table.element(a,'Standard Deviation',header=TRUE)
a<-table.element(a,'Range',header=TRUE)
a<-table.row.end(a)
for (j in 1:np) {
a<-table.row.start(a)
a<-table.element(a,j,header=TRUE)
a<-table.element(a,arr.mean[j])
a<-table.element(a,arr.sd[j] )
a<-table.element(a,arr.range[j] )
a<-table.row.end(a)
}
a<-table.end(a)
table.save(a,file='mytable.tab')
a<-table.start()
a<-table.row.start(a)
a<-table.element(a,'Regression: S.E.(k) = alpha + beta * Mean(k)',2,TRUE)
a<-table.row.end(a)
a<-table.row.start(a)
a<-table.element(a,'alpha',header=TRUE)
a<-table.element(a,lm1$coefficients[[1]])
a<-table.row.end(a)
a<-table.row.start(a)
a<-table.element(a,'beta',header=TRUE)
a<-table.element(a,lm1$coefficients[[2]])
a<-table.row.end(a)
a<-table.row.start(a)
a<-table.element(a,'S.D.',header=TRUE)
a<-table.element(a,summary(lm1)$coefficients[2,2])
a<-table.row.end(a)
a<-table.row.start(a)
a<-table.element(a,'T-STAT',header=TRUE)
a<-table.element(a,summary(lm1)$coefficients[2,3])
a<-table.row.end(a)
a<-table.row.start(a)
a<-table.element(a,'p-value',header=TRUE)
a<-table.element(a,summary(lm1)$coefficients[2,4])
a<-table.row.end(a)
a<-table.end(a)
table.save(a,file='mytable1.tab')
a<-table.start()
a<-table.row.start(a)
a<-table.element(a,'Regression: ln S.E.(k) = alpha + beta * ln Mean(k)',2,TRUE)
a<-table.row.end(a)
a<-table.row.start(a)
a<-table.element(a,'alpha',header=TRUE)
a<-table.element(a,lnlm1$coefficients[[1]])
a<-table.row.end(a)
a<-table.row.start(a)
a<-table.element(a,'beta',header=TRUE)
a<-table.element(a,lnlm1$coefficients[[2]])
a<-table.row.end(a)
a<-table.row.start(a)
a<-table.element(a,'S.D.',header=TRUE)
a<-table.element(a,summary(lnlm1)$coefficients[2,2])
a<-table.row.end(a)
a<-table.row.start(a)
a<-table.element(a,'T-STAT',header=TRUE)
a<-table.element(a,summary(lnlm1)$coefficients[2,3])
a<-table.row.end(a)
a<-table.row.start(a)
a<-table.element(a,'p-value',header=TRUE)
a<-table.element(a,summary(lnlm1)$coefficients[2,4])
a<-table.row.end(a)
a<-table.row.start(a)
a<-table.element(a,'Lambda',header=TRUE)
a<-table.element(a,1-lnlm1$coefficients[[2]])
a<-table.row.end(a)
a<-table.end(a)
table.save(a,file='mytable2.tab')