Free Statistics

of Irreproducible Research!

Author's title

Author*The author of this computation has been verified*
R Software Modulerwasp_cross.wasp
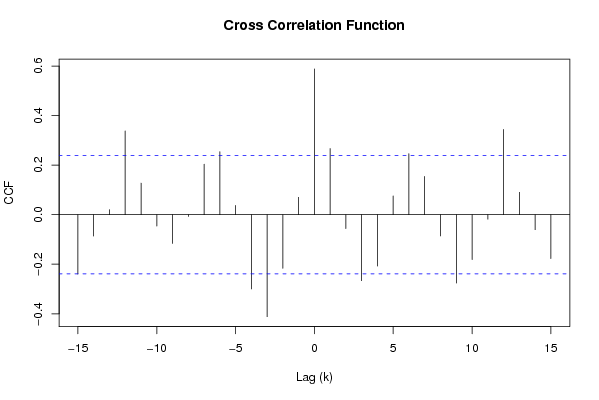
Title produced by softwareCross Correlation Function
Date of computationMon, 01 Dec 2008 13:56:24 -0700
Cite this page as followsStatistical Computations at FreeStatistics.org, Office for Research Development and Education, URL https://freestatistics.org/blog/index.php?v=date/2008/Dec/01/t1228165016vsyc6uzmlr1oqeu.htm/, Retrieved Sun, 05 May 2024 16:01:36 +0000
Statistical Computations at FreeStatistics.org, Office for Research Development and Education, URL https://freestatistics.org/blog/index.php?pk=27396, Retrieved Sun, 05 May 2024 16:01:36 +0000
QR Codes:

Original text written by user:
IsPrivate?No (this computation is public)
User-defined keywords
Estimated Impact232
Family? (F = Feedback message, R = changed R code, M = changed R Module, P = changed Parameters, D = changed Data)
F     [Univariate Data Series] [Airline data] [2007-10-18 09:58:47] [42daae401fd3def69a25014f2252b4c2]
- RMPD  [Spectral Analysis] [Q6 non statistica...] [2008-12-01 11:41:39] [7d3039e6253bb5fb3b26df1537d500b4]
F RMPD      [Cross Correlation Function] [Q9 Cross Correlat...] [2008-12-01 20:56:24] [35348cd8592af0baf5f138bd59921307] [Current]
-   P         [Cross Correlation Function] [Q9 Cross Correlat...] [2008-12-07 15:28:13] [7d3039e6253bb5fb3b26df1537d500b4]
Feedback Forum
2008-12-08 17:01:33 [Lindsay Heyndrickx] [reply
Hier had je de gegevens van q8 nodig om de juiste parameters in te stellen. Hier weet je dus niet of de juiste parameters zijn ingesteld en dus ook niet of de juiste berekeningen zijn gemaakt. De uitleg is wel correct.
2008-12-08 17:01:40 [Lindsay Heyndrickx] [reply
Hier had je de gegevens van q8 nodig om de juiste parameters in te stellen. Hier weet je dus niet of de juiste parameters zijn ingesteld en dus ook niet of de juiste berekeningen zijn gemaakt. De uitleg is wel correct.

Post a new message
Dataseries X:
7.8
7.6
7.5
7.6
7.5
7.3
7.6
7.5
7.6
7.9
7.9
8.1
8.2
8.0
7.5
6.8
6.5
6.6
7.6
8.0
8.0
7.7
7.5
7.6
7.7
7.9
7.8
7.5
7.5
7.1
7.5
7.5
7.6
7.7
7.7
7.9
8.1
8.2
8.2
8.1
7.9
7.3
6.9
6.6
6.7
6.9
7.0
7.1
7.2
7.1
6.9
7.0
6.8
6.4
6.7
6.7
6.4
6.3
6.2
6.5
6.8
6.8
6.5
6.3
5.9
5.9
6.4
6.4
Dataseries Y:
9.0
9.1
8.7
8.2
7.9
7.9
9.1
9.4
9.5
9.1
9.0
9.3
9.9
9.8
9.4
8.3
8.0
8.5
10.4
11.1
10.9
9.9
9.2
9.2
9.5
9.6
9.5
9.1
8.9
9.0
10.1
10.3
10.2
9.6
9.2
9.3
9.4
9.4
9.2
9.0
9.0
9.0
9.8
10.0
9.9
9.3
9.0
9.0
9.1
9.1
9.1
9.2
8.8
8.3
8.4
8.1
7.8
7.9
7.9
8.0
7.9
7.5
7.2
6.9
6.6
6.7
7.3
7.5


Summary of computational transaction
Raw Inputview raw input (R code)
Raw Outputview raw output of R engine
Computing time1 seconds
R Server'Gwilym Jenkins' @ 72.249.127.135

\begin{tabular}{lllllllll}
\hline
Summary of computational transaction \tabularnewline
Raw Input & view raw input (R code)  \tabularnewline
Raw Output & view raw output of R engine  \tabularnewline
Computing time & 1 seconds \tabularnewline
R Server & 'Gwilym Jenkins' @ 72.249.127.135 \tabularnewline
\hline
\end{tabular}
%Source: https://freestatistics.org/blog/index.php?pk=27396&T=0

[TABLE]
[ROW][C]Summary of computational transaction[/C][/ROW]
[ROW][C]Raw Input[/C][C]view raw input (R code) [/C][/ROW]
[ROW][C]Raw Output[/C][C]view raw output of R engine [/C][/ROW]
[ROW][C]Computing time[/C][C]1 seconds[/C][/ROW]
[ROW][C]R Server[/C][C]'Gwilym Jenkins' @ 72.249.127.135[/C][/ROW]
[/TABLE]
Source: https://freestatistics.org/blog/index.php?pk=27396&T=0

Globally Unique Identifier (entire table): ba.freestatistics.org/blog/index.php?pk=27396&T=0

As an alternative you can also use a QR Code:  

The GUIDs for individual cells are displayed in the table below:

Summary of computational transaction
Raw Inputview raw input (R code)
Raw Outputview raw output of R engine
Computing time1 seconds
R Server'Gwilym Jenkins' @ 72.249.127.135


Cross Correlation Function
ParameterValue
Box-Cox transformation parameter (lambda) of X series1
Degree of non-seasonal differencing (d) of X series1
Degree of seasonal differencing (D) of X series0
Seasonal Period (s)1
Box-Cox transformation parameter (lambda) of Y series1
Degree of non-seasonal differencing (d) of Y series1
Degree of seasonal differencing (D) of Y series0
krho(Y[t],X[t+k])
-15-0.239635205432394
-14-0.0866087987085784
-130.0200288276351517
-120.337841069966043
-110.127344345600814
-10-0.0462215050637655
-9-0.116304691803540
-8-0.00734589422346472
-70.203796404275998
-60.254483410519776
-50.0373176493934073
-4-0.299717551699424
-3-0.411685753733839
-2-0.216705043021761
-10.0703430193408576
00.588261008852756
10.266759143586482
2-0.0559725959915867
3-0.266595229288883
4-0.207632877875477
50.0755823304462849
60.24608215641808
70.154410887896752
8-0.0859019506176709
9-0.276153707990031
10-0.181039980679225
11-0.0182138775260924
120.344302240646316
130.0901663077542573
14-0.0608680490279187
15-0.177431280733034

\begin{tabular}{lllllllll}
\hline
Cross Correlation Function \tabularnewline
Parameter & Value \tabularnewline
Box-Cox transformation parameter (lambda) of X series & 1 \tabularnewline
Degree of non-seasonal differencing (d) of X series & 1 \tabularnewline
Degree of seasonal differencing (D) of X series & 0 \tabularnewline
Seasonal Period (s) & 1 \tabularnewline
Box-Cox transformation parameter (lambda) of Y series & 1 \tabularnewline
Degree of non-seasonal differencing (d) of Y series & 1 \tabularnewline
Degree of seasonal differencing (D) of Y series & 0 \tabularnewline
k & rho(Y[t],X[t+k]) \tabularnewline
-15 & -0.239635205432394 \tabularnewline
-14 & -0.0866087987085784 \tabularnewline
-13 & 0.0200288276351517 \tabularnewline
-12 & 0.337841069966043 \tabularnewline
-11 & 0.127344345600814 \tabularnewline
-10 & -0.0462215050637655 \tabularnewline
-9 & -0.116304691803540 \tabularnewline
-8 & -0.00734589422346472 \tabularnewline
-7 & 0.203796404275998 \tabularnewline
-6 & 0.254483410519776 \tabularnewline
-5 & 0.0373176493934073 \tabularnewline
-4 & -0.299717551699424 \tabularnewline
-3 & -0.411685753733839 \tabularnewline
-2 & -0.216705043021761 \tabularnewline
-1 & 0.0703430193408576 \tabularnewline
0 & 0.588261008852756 \tabularnewline
1 & 0.266759143586482 \tabularnewline
2 & -0.0559725959915867 \tabularnewline
3 & -0.266595229288883 \tabularnewline
4 & -0.207632877875477 \tabularnewline
5 & 0.0755823304462849 \tabularnewline
6 & 0.24608215641808 \tabularnewline
7 & 0.154410887896752 \tabularnewline
8 & -0.0859019506176709 \tabularnewline
9 & -0.276153707990031 \tabularnewline
10 & -0.181039980679225 \tabularnewline
11 & -0.0182138775260924 \tabularnewline
12 & 0.344302240646316 \tabularnewline
13 & 0.0901663077542573 \tabularnewline
14 & -0.0608680490279187 \tabularnewline
15 & -0.177431280733034 \tabularnewline
\hline
\end{tabular}
%Source: https://freestatistics.org/blog/index.php?pk=27396&T=1

[TABLE]
[ROW][C]Cross Correlation Function[/C][/ROW]
[ROW][C]Parameter[/C][C]Value[/C][/ROW]
[ROW][C]Box-Cox transformation parameter (lambda) of X series[/C][C]1[/C][/ROW]
[ROW][C]Degree of non-seasonal differencing (d) of X series[/C][C]1[/C][/ROW]
[ROW][C]Degree of seasonal differencing (D) of X series[/C][C]0[/C][/ROW]
[ROW][C]Seasonal Period (s)[/C][C]1[/C][/ROW]
[ROW][C]Box-Cox transformation parameter (lambda) of Y series[/C][C]1[/C][/ROW]
[ROW][C]Degree of non-seasonal differencing (d) of Y series[/C][C]1[/C][/ROW]
[ROW][C]Degree of seasonal differencing (D) of Y series[/C][C]0[/C][/ROW]
[ROW][C]k[/C][C]rho(Y[t],X[t+k])[/C][/ROW]
[ROW][C]-15[/C][C]-0.239635205432394[/C][/ROW]
[ROW][C]-14[/C][C]-0.0866087987085784[/C][/ROW]
[ROW][C]-13[/C][C]0.0200288276351517[/C][/ROW]
[ROW][C]-12[/C][C]0.337841069966043[/C][/ROW]
[ROW][C]-11[/C][C]0.127344345600814[/C][/ROW]
[ROW][C]-10[/C][C]-0.0462215050637655[/C][/ROW]
[ROW][C]-9[/C][C]-0.116304691803540[/C][/ROW]
[ROW][C]-8[/C][C]-0.00734589422346472[/C][/ROW]
[ROW][C]-7[/C][C]0.203796404275998[/C][/ROW]
[ROW][C]-6[/C][C]0.254483410519776[/C][/ROW]
[ROW][C]-5[/C][C]0.0373176493934073[/C][/ROW]
[ROW][C]-4[/C][C]-0.299717551699424[/C][/ROW]
[ROW][C]-3[/C][C]-0.411685753733839[/C][/ROW]
[ROW][C]-2[/C][C]-0.216705043021761[/C][/ROW]
[ROW][C]-1[/C][C]0.0703430193408576[/C][/ROW]
[ROW][C]0[/C][C]0.588261008852756[/C][/ROW]
[ROW][C]1[/C][C]0.266759143586482[/C][/ROW]
[ROW][C]2[/C][C]-0.0559725959915867[/C][/ROW]
[ROW][C]3[/C][C]-0.266595229288883[/C][/ROW]
[ROW][C]4[/C][C]-0.207632877875477[/C][/ROW]
[ROW][C]5[/C][C]0.0755823304462849[/C][/ROW]
[ROW][C]6[/C][C]0.24608215641808[/C][/ROW]
[ROW][C]7[/C][C]0.154410887896752[/C][/ROW]
[ROW][C]8[/C][C]-0.0859019506176709[/C][/ROW]
[ROW][C]9[/C][C]-0.276153707990031[/C][/ROW]
[ROW][C]10[/C][C]-0.181039980679225[/C][/ROW]
[ROW][C]11[/C][C]-0.0182138775260924[/C][/ROW]
[ROW][C]12[/C][C]0.344302240646316[/C][/ROW]
[ROW][C]13[/C][C]0.0901663077542573[/C][/ROW]
[ROW][C]14[/C][C]-0.0608680490279187[/C][/ROW]
[ROW][C]15[/C][C]-0.177431280733034[/C][/ROW]
[/TABLE]
Source: https://freestatistics.org/blog/index.php?pk=27396&T=1

Globally Unique Identifier (entire table): ba.freestatistics.org/blog/index.php?pk=27396&T=1

As an alternative you can also use a QR Code:  

The GUIDs for individual cells are displayed in the table below:

Cross Correlation Function
ParameterValue
Box-Cox transformation parameter (lambda) of X series1
Degree of non-seasonal differencing (d) of X series1
Degree of seasonal differencing (D) of X series0
Seasonal Period (s)1
Box-Cox transformation parameter (lambda) of Y series1
Degree of non-seasonal differencing (d) of Y series1
Degree of seasonal differencing (D) of Y series0
krho(Y[t],X[t+k])
-15-0.239635205432394
-14-0.0866087987085784
-130.0200288276351517
-120.337841069966043
-110.127344345600814
-10-0.0462215050637655
-9-0.116304691803540
-8-0.00734589422346472
-70.203796404275998
-60.254483410519776
-50.0373176493934073
-4-0.299717551699424
-3-0.411685753733839
-2-0.216705043021761
-10.0703430193408576
00.588261008852756
10.266759143586482
2-0.0559725959915867
3-0.266595229288883
4-0.207632877875477
50.0755823304462849
60.24608215641808
70.154410887896752
8-0.0859019506176709
9-0.276153707990031
10-0.181039980679225
11-0.0182138775260924
120.344302240646316
130.0901663077542573
14-0.0608680490279187
15-0.177431280733034


Parameters (Session):
par1 = 36 ; par2 = 1 ; par3 = 0 ; par4 = 0 ; par5 = 12 ;
Parameters (R input):
par1 = 1 ; par2 = 1 ; par3 = 0 ; par4 = 1 ; par5 = 1 ; par6 = 1 ; par7 = 0 ;
R code (references can be found in the software module):
par1 <- as.numeric(par1)
par2 <- as.numeric(par2)
par3 <- as.numeric(par3)
par4 <- as.numeric(par4)
par5 <- as.numeric(par5)
par6 <- as.numeric(par6)
par7 <- as.numeric(par7)
if (par1 == 0) {
x <- log(x)
} else {
x <- (x ^ par1 - 1) / par1
}
if (par5 == 0) {
y <- log(y)
} else {
y <- (y ^ par5 - 1) / par5
}
if (par2 > 0) x <- diff(x,lag=1,difference=par2)
if (par6 > 0) y <- diff(y,lag=1,difference=par6)
if (par3 > 0) x <- diff(x,lag=par4,difference=par3)
if (par7 > 0) y <- diff(y,lag=par4,difference=par7)
x
y
bitmap(file='test1.png')
(r <- ccf(x,y,main='Cross Correlation Function',ylab='CCF',xlab='Lag (k)'))
dev.off()
load(file='createtable')
a<-table.start()
a<-table.row.start(a)
a<-table.element(a,'Cross Correlation Function',2,TRUE)
a<-table.row.end(a)
a<-table.row.start(a)
a<-table.element(a,'Parameter',header=TRUE)
a<-table.element(a,'Value',header=TRUE)
a<-table.row.end(a)
a<-table.row.start(a)
a<-table.element(a,'Box-Cox transformation parameter (lambda) of X series',header=TRUE)
a<-table.element(a,par1)
a<-table.row.end(a)
a<-table.row.start(a)
a<-table.element(a,'Degree of non-seasonal differencing (d) of X series',header=TRUE)
a<-table.element(a,par2)
a<-table.row.end(a)
a<-table.row.start(a)
a<-table.element(a,'Degree of seasonal differencing (D) of X series',header=TRUE)
a<-table.element(a,par3)
a<-table.row.end(a)
a<-table.row.start(a)
a<-table.element(a,'Seasonal Period (s)',header=TRUE)
a<-table.element(a,par4)
a<-table.row.end(a)
a<-table.row.start(a)
a<-table.element(a,'Box-Cox transformation parameter (lambda) of Y series',header=TRUE)
a<-table.element(a,par5)
a<-table.row.end(a)
a<-table.row.start(a)
a<-table.element(a,'Degree of non-seasonal differencing (d) of Y series',header=TRUE)
a<-table.element(a,par6)
a<-table.row.end(a)
a<-table.row.start(a)
a<-table.element(a,'Degree of seasonal differencing (D) of Y series',header=TRUE)
a<-table.element(a,par7)
a<-table.row.end(a)
a<-table.row.start(a)
a<-table.element(a,'k',header=TRUE)
a<-table.element(a,'rho(Y[t],X[t+k])',header=TRUE)
a<-table.row.end(a)
mylength <- length(r$acf)
myhalf <- floor((mylength-1)/2)
for (i in 1:mylength) {
a<-table.row.start(a)
a<-table.element(a,i-myhalf-1,header=TRUE)
a<-table.element(a,r$acf[i])
a<-table.row.end(a)
}
a<-table.end(a)
table.save(a,file='mytable.tab')