| Multiple Linear Regression - Estimated Regression Equation |
| Textiel[t] = + 7.50579583333333 + 1.18902083333333dummy[t] -0.2024M1[t] -0.252199999999998M2[t] -0.227599999999999M3[t] -0.197600000000000M4[t] -0.212999999999998M5[t] -0.201999999999999M6[t] + 0.194000000000001M7[t] + 0.238200000000001M8[t] -0.0273999999999989M9[t] -0.00919999999999873M10[t] -0.113599999999999M11[t] + e[t] |
| Multiple Linear Regression - Ordinary Least Squares | |||||
| Variable | Parameter | S.D. | T-STAT H0: parameter = 0 | 2-tail p-value | 1-tail p-value |
| (Intercept) | 7.50579583333333 | 0.460791 | 16.2889 | 0 | 0 |
| dummy | 1.18902083333333 | 0.329136 | 3.6125 | 0.000735 | 0.000368 |
| M1 | -0.2024 | 0.644973 | -0.3138 | 0.755053 | 0.377526 |
| M2 | -0.252199999999998 | 0.644973 | -0.391 | 0.697546 | 0.348773 |
| M3 | -0.227599999999999 | 0.644973 | -0.3529 | 0.725754 | 0.362877 |
| M4 | -0.197600000000000 | 0.644973 | -0.3064 | 0.760676 | 0.380338 |
| M5 | -0.212999999999998 | 0.644973 | -0.3302 | 0.742681 | 0.371341 |
| M6 | -0.201999999999999 | 0.644973 | -0.3132 | 0.755521 | 0.37776 |
| M7 | 0.194000000000001 | 0.644973 | 0.3008 | 0.764903 | 0.382451 |
| M8 | 0.238200000000001 | 0.644973 | 0.3693 | 0.71355 | 0.356775 |
| M9 | -0.0273999999999989 | 0.644973 | -0.0425 | 0.966294 | 0.483147 |
| M10 | -0.00919999999999873 | 0.644973 | -0.0143 | 0.98868 | 0.49434 |
| M11 | -0.113599999999999 | 0.644973 | -0.1761 | 0.860947 | 0.430474 |
| Multiple Linear Regression - Regression Statistics | |
| Multiple R | 0.485732366547749 |
| R-squared | 0.235935931912077 |
| Adjusted R-squared | 0.0408557443151606 |
| F-TEST (value) | 1.20943051582244 |
| F-TEST (DF numerator) | 12 |
| F-TEST (DF denominator) | 47 |
| p-value | 0.305008961144369 |
| Multiple Linear Regression - Residual Statistics | |
| Residual Standard Deviation | 1.01979161822021 |
| Sum Squared Residuals | 48.8788223958333 |
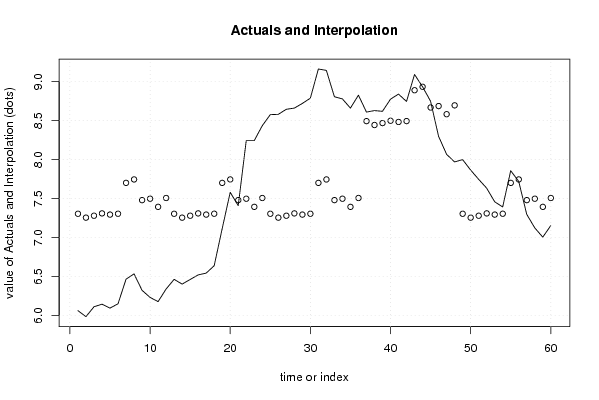
| Multiple Linear Regression - Actuals, Interpolation, and Residuals | |||
| Time or Index | Actuals | Interpolation Forecast | Residuals Prediction Error |
| 1 | 6.06 | 7.30339583333334 | -1.24339583333334 |
| 2 | 5.983 | 7.25359583333333 | -1.27059583333333 |
| 3 | 6.11 | 7.27819583333333 | -1.16819583333333 |
| 4 | 6.143 | 7.30819583333333 | -1.16519583333333 |
| 5 | 6.093 | 7.29279583333333 | -1.19979583333333 |
| 6 | 6.148 | 7.30379583333333 | -1.15579583333333 |
| 7 | 6.464 | 7.69979583333333 | -1.23579583333333 |
| 8 | 6.532 | 7.74399583333333 | -1.21199583333333 |
| 9 | 6.321 | 7.47839583333333 | -1.15739583333333 |
| 10 | 6.23 | 7.49659583333333 | -1.26659583333333 |
| 11 | 6.176 | 7.39219583333333 | -1.21619583333333 |
| 12 | 6.338 | 7.50579583333333 | -1.16779583333333 |
| 13 | 6.462 | 7.30339583333333 | -0.841395833333333 |
| 14 | 6.401 | 7.25359583333333 | -0.852595833333335 |
| 15 | 6.46 | 7.27819583333333 | -0.818195833333333 |
| 16 | 6.519 | 7.30819583333333 | -0.789195833333333 |
| 17 | 6.542 | 7.29279583333333 | -0.750795833333334 |
| 18 | 6.637 | 7.30379583333333 | -0.666795833333334 |
| 19 | 7.114 | 7.69979583333333 | -0.585795833333334 |
| 20 | 7.579 | 7.74399583333333 | -0.164995833333333 |
| 21 | 7.408 | 7.47839583333333 | -0.070395833333333 |
| 22 | 8.243 | 7.49659583333333 | 0.746404166666667 |
| 23 | 8.243 | 7.39219583333333 | 0.850804166666667 |
| 24 | 8.434 | 7.50579583333333 | 0.928204166666668 |
| 25 | 8.576 | 7.30339583333333 | 1.27260416666667 |
| 26 | 8.58 | 7.25359583333333 | 1.32640416666667 |
| 27 | 8.645 | 7.27819583333333 | 1.36680416666667 |
| 28 | 8.66 | 7.30819583333333 | 1.35180416666667 |
| 29 | 8.72 | 7.29279583333333 | 1.42720416666667 |
| 30 | 8.787 | 7.30379583333333 | 1.48320416666667 |
| 31 | 9.162 | 7.69979583333333 | 1.46220416666667 |
| 32 | 9.144 | 7.74399583333333 | 1.40000416666667 |
| 33 | 8.806 | 7.47839583333333 | 1.32760416666667 |
| 34 | 8.778 | 7.49659583333333 | 1.28140416666667 |
| 35 | 8.66 | 7.39219583333333 | 1.26780416666667 |
| 36 | 8.826 | 7.50579583333333 | 1.32020416666667 |
| 37 | 8.609 | 8.49241666666667 | 0.116583333333334 |
| 38 | 8.628 | 8.44261666666667 | 0.185383333333332 |
| 39 | 8.619 | 8.46721666666667 | 0.151783333333333 |
| 40 | 8.775 | 8.49721666666667 | 0.277783333333334 |
| 41 | 8.84 | 8.48181666666667 | 0.358183333333332 |
| 42 | 8.745 | 8.49281666666667 | 0.252183333333332 |
| 43 | 9.092 | 8.88881666666667 | 0.203183333333333 |
| 44 | 8.934 | 8.93301666666667 | 0.000983333333332614 |
| 45 | 8.749 | 8.66741666666667 | 0.0815833333333335 |
| 46 | 8.298 | 8.68561666666667 | -0.387616666666667 |
| 47 | 8.067 | 8.58121666666667 | -0.514216666666667 |
| 48 | 7.969 | 8.69481666666667 | -0.725816666666665 |
| 49 | 7.999 | 7.30339583333333 | 0.695604166666667 |
| 50 | 7.865 | 7.25359583333333 | 0.611404166666666 |
| 51 | 7.746 | 7.27819583333333 | 0.467804166666667 |
| 52 | 7.633 | 7.30819583333333 | 0.324804166666667 |
| 53 | 7.458 | 7.29279583333333 | 0.165204166666666 |
| 54 | 7.391 | 7.30379583333333 | 0.0872041666666665 |
| 55 | 7.856 | 7.69979583333333 | 0.156204166666666 |
| 56 | 7.72 | 7.74399583333333 | -0.0239958333333335 |
| 57 | 7.297 | 7.47839583333333 | -0.181395833333334 |
| 58 | 7.123 | 7.49659583333333 | -0.373595833333333 |
| 59 | 7.004 | 7.39219583333333 | -0.388195833333334 |
| 60 | 7.151 | 7.50579583333333 | -0.354795833333332 |
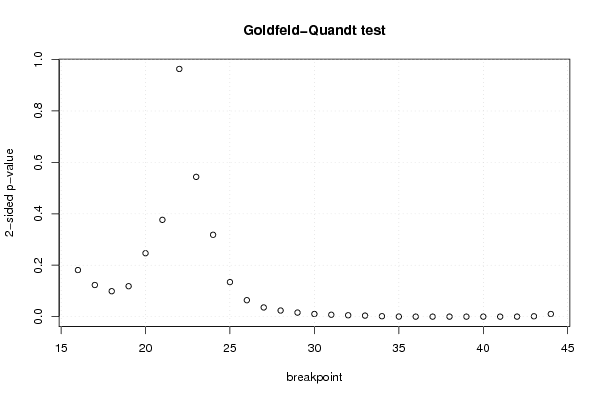
| Goldfeld-Quandt test for Heteroskedasticity | |||
| p-values | Alternative Hypothesis | ||
| breakpoint index | greater | 2-sided | less |
| 16 | 0.0906382840816514 | 0.181276568163303 | 0.909361715918349 |
| 17 | 0.0615670759541935 | 0.123134151908387 | 0.938432924045806 |
| 18 | 0.0495036831288467 | 0.0990073662576935 | 0.950496316871153 |
| 19 | 0.0592056307568999 | 0.118411261513800 | 0.9407943692431 |
| 20 | 0.123402791614211 | 0.246805583228422 | 0.87659720838579 |
| 21 | 0.188287355214924 | 0.376574710429847 | 0.811712644785076 |
| 22 | 0.518240318837301 | 0.963519362325398 | 0.481759681162699 |
| 23 | 0.728135966238649 | 0.543728067522703 | 0.271864033761351 |
| 24 | 0.840800731646575 | 0.318398536706850 | 0.159199268353425 |
| 25 | 0.9327342335691 | 0.134531532861802 | 0.0672657664309009 |
| 26 | 0.967988967335643 | 0.0640220653287144 | 0.0320110326643572 |
| 27 | 0.98209713217355 | 0.0358057356529009 | 0.0179028678264505 |
| 28 | 0.98810053336081 | 0.0237989332783819 | 0.0118994666391910 |
| 29 | 0.992078379532938 | 0.0158432409341246 | 0.00792162046706231 |
| 30 | 0.994823255650575 | 0.0103534886988497 | 0.00517674434942486 |
| 31 | 0.99628258268853 | 0.00743483462294111 | 0.00371741731147055 |
| 32 | 0.997319071282426 | 0.00536185743514751 | 0.00268092871757376 |
| 33 | 0.99797221557378 | 0.00405556885244061 | 0.00202778442622031 |
| 34 | 0.999132350817223 | 0.00173529836555352 | 0.00086764918277676 |
| 35 | 0.99985274474243 | 0.000294510515141988 | 0.000147255257570994 |
| 36 | 0.999999970505215 | 5.8989568999894e-08 | 2.9494784499947e-08 |
| 37 | 0.999999965643897 | 6.87122051117157e-08 | 3.43561025558579e-08 |
| 38 | 0.99999993131221 | 1.37375580659605e-07 | 6.86877903298024e-08 |
| 39 | 0.999999796466867 | 4.07066265096903e-07 | 2.03533132548451e-07 |
| 40 | 0.999998051033568 | 3.89793286463067e-06 | 1.94896643231533e-06 |
| 41 | 0.999987320972186 | 2.53580556276438e-05 | 1.26790278138219e-05 |
| 42 | 0.999917600655659 | 0.000164798688682476 | 8.2399344341238e-05 |
| 43 | 0.999317696019518 | 0.00136460796096411 | 0.000682303980482054 |
| 44 | 0.994795794255112 | 0.0104084114897765 | 0.00520420574488825 |
| Meta Analysis of Goldfeld-Quandt test for Heteroskedasticity | |||
| Description | # significant tests | % significant tests | OK/NOK |
| 1% type I error level | 13 | 0.448275862068966 | NOK |
| 5% type I error level | 18 | 0.620689655172414 | NOK |
| 10% type I error level | 20 | 0.689655172413793 | NOK |