Free Statistics

of Irreproducible Research!

Author's title

Author*The author of this computation has been verified*
R Software Modulerwasp_cross.wasp
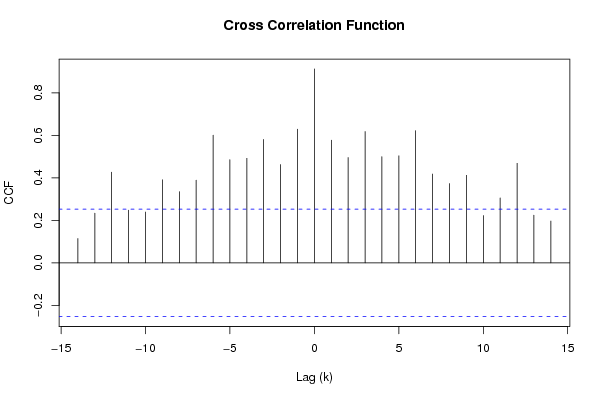
Title produced by softwareCross Correlation Function
Date of computationMon, 01 Dec 2008 12:00:26 -0700
Cite this page as followsStatistical Computations at FreeStatistics.org, Office for Research Development and Education, URL https://freestatistics.org/blog/index.php?v=date/2008/Dec/01/t12281580572gehml0fx5ic1cg.htm/, Retrieved Sun, 05 May 2024 15:13:13 +0000
Statistical Computations at FreeStatistics.org, Office for Research Development and Education, URL https://freestatistics.org/blog/index.php?pk=27168, Retrieved Sun, 05 May 2024 15:13:13 +0000
QR Codes:

Original text written by user:
IsPrivate?No (this computation is public)
User-defined keywords
Estimated Impact238
Family? (F = Feedback message, R = changed R code, M = changed R Module, P = changed Parameters, D = changed Data)
F     [Univariate Data Series] [Airline data] [2007-10-18 09:58:47] [42daae401fd3def69a25014f2252b4c2]
F RMPD  [Cross Correlation Function] [Q7 CCF d=0 D0] [2008-11-29 13:48:28] [6743688719638b0cb1c0a6e0bf433315]
-   PD      [Cross Correlation Function] [q7] [2008-12-01 19:00:26] [5d823194959040fa9b19b8c8302177e6] [Current]
Feedback Forum

Post a new message
Dataseries X:
2236
2084.9
2409.5
2199.3
2203.5
2254.1
1975.8
1742.2
2520.6
2438.1
2126.3
2267.5
2201.1
2128.5
2596
2458.2
2210.5
2621.2
2231.4
2103.6
2685.8
2539.3
2462.4
2693.3
2307.7
2385.9
2737.6
2653.9
2545.4
2848.8
2359.5
2488.3
2861.1
2717.9
2844
2749
2652.9
2660.2
3187.1
2774.1
3158.2
3244.6
2665.5
2820.8
2983.4
3077.4
3024.8
2731.8
3046.2
2834.8
3292.8
2946.1
3196.9
3284.2
3003
2979
3137.4
3647.7
3283
2947.3
Dataseries Y:
3258.1
3140.1
3627.4
3279.4
3204
3515.6
3146.6
2271.7
3627.9
3553.4
3018.3
3355.4
3242
3311.1
4125.2
3423
3120.3
3863
3240.8
2837.4
3945
3684.1
3659.6
3769.6
3592.7
3754
4507.8
3853.2
3817.2
3958.4
3428.9
3125.7
3977
3983.3
4299.6
4306.9
4259.5
3986
4755.6
3925.6
4206.5
4323.4
3816.1
3410.7
4227.4
4296.9
4351.7
3800
4277
4100.2
4672.5
4189.9
4231.9
4654.9
4298.5
3635.9
4505.1
4910.1
4908.7
4101.4


Summary of computational transaction
Raw Inputview raw input (R code)
Raw Outputview raw output of R engine
Computing time1 seconds
R Server'George Udny Yule' @ 72.249.76.132

\begin{tabular}{lllllllll}
\hline
Summary of computational transaction \tabularnewline
Raw Input & view raw input (R code)  \tabularnewline
Raw Output & view raw output of R engine  \tabularnewline
Computing time & 1 seconds \tabularnewline
R Server & 'George Udny Yule' @ 72.249.76.132 \tabularnewline
\hline
\end{tabular}
%Source: https://freestatistics.org/blog/index.php?pk=27168&T=0

[TABLE]
[ROW][C]Summary of computational transaction[/C][/ROW]
[ROW][C]Raw Input[/C][C]view raw input (R code) [/C][/ROW]
[ROW][C]Raw Output[/C][C]view raw output of R engine [/C][/ROW]
[ROW][C]Computing time[/C][C]1 seconds[/C][/ROW]
[ROW][C]R Server[/C][C]'George Udny Yule' @ 72.249.76.132[/C][/ROW]
[/TABLE]
Source: https://freestatistics.org/blog/index.php?pk=27168&T=0

Globally Unique Identifier (entire table): ba.freestatistics.org/blog/index.php?pk=27168&T=0

As an alternative you can also use a QR Code:  

The GUIDs for individual cells are displayed in the table below:

Summary of computational transaction
Raw Inputview raw input (R code)
Raw Outputview raw output of R engine
Computing time1 seconds
R Server'George Udny Yule' @ 72.249.76.132


Cross Correlation Function
ParameterValue
Box-Cox transformation parameter (lambda) of X series1
Degree of non-seasonal differencing (d) of X series0
Degree of seasonal differencing (D) of X series0
Seasonal Period (s)12
Box-Cox transformation parameter (lambda) of Y series1
Degree of non-seasonal differencing (d) of Y series0
Degree of seasonal differencing (D) of Y series0
krho(Y[t],X[t+k])
-140.114078693818204
-130.233485219019265
-120.426700551174168
-110.248144980491881
-100.238943970833954
-90.390686114467686
-80.335020094975612
-70.389252413710827
-60.600889133887761
-50.485169963236553
-40.492211523287487
-30.580497050468973
-20.462526845277438
-10.629153402101791
00.912341023942634
10.577090263940596
20.495239939699384
30.617731402194501
40.499470912512376
50.50381564861295
60.62197704005522
70.417579351828502
80.373382368339701
90.411841091049052
100.2222724369044
110.305397676751643
120.468139050289122
130.224500077535106
140.196907763684439

\begin{tabular}{lllllllll}
\hline
Cross Correlation Function \tabularnewline
Parameter & Value \tabularnewline
Box-Cox transformation parameter (lambda) of X series & 1 \tabularnewline
Degree of non-seasonal differencing (d) of X series & 0 \tabularnewline
Degree of seasonal differencing (D) of X series & 0 \tabularnewline
Seasonal Period (s) & 12 \tabularnewline
Box-Cox transformation parameter (lambda) of Y series & 1 \tabularnewline
Degree of non-seasonal differencing (d) of Y series & 0 \tabularnewline
Degree of seasonal differencing (D) of Y series & 0 \tabularnewline
k & rho(Y[t],X[t+k]) \tabularnewline
-14 & 0.114078693818204 \tabularnewline
-13 & 0.233485219019265 \tabularnewline
-12 & 0.426700551174168 \tabularnewline
-11 & 0.248144980491881 \tabularnewline
-10 & 0.238943970833954 \tabularnewline
-9 & 0.390686114467686 \tabularnewline
-8 & 0.335020094975612 \tabularnewline
-7 & 0.389252413710827 \tabularnewline
-6 & 0.600889133887761 \tabularnewline
-5 & 0.485169963236553 \tabularnewline
-4 & 0.492211523287487 \tabularnewline
-3 & 0.580497050468973 \tabularnewline
-2 & 0.462526845277438 \tabularnewline
-1 & 0.629153402101791 \tabularnewline
0 & 0.912341023942634 \tabularnewline
1 & 0.577090263940596 \tabularnewline
2 & 0.495239939699384 \tabularnewline
3 & 0.617731402194501 \tabularnewline
4 & 0.499470912512376 \tabularnewline
5 & 0.50381564861295 \tabularnewline
6 & 0.62197704005522 \tabularnewline
7 & 0.417579351828502 \tabularnewline
8 & 0.373382368339701 \tabularnewline
9 & 0.411841091049052 \tabularnewline
10 & 0.2222724369044 \tabularnewline
11 & 0.305397676751643 \tabularnewline
12 & 0.468139050289122 \tabularnewline
13 & 0.224500077535106 \tabularnewline
14 & 0.196907763684439 \tabularnewline
\hline
\end{tabular}
%Source: https://freestatistics.org/blog/index.php?pk=27168&T=1

[TABLE]
[ROW][C]Cross Correlation Function[/C][/ROW]
[ROW][C]Parameter[/C][C]Value[/C][/ROW]
[ROW][C]Box-Cox transformation parameter (lambda) of X series[/C][C]1[/C][/ROW]
[ROW][C]Degree of non-seasonal differencing (d) of X series[/C][C]0[/C][/ROW]
[ROW][C]Degree of seasonal differencing (D) of X series[/C][C]0[/C][/ROW]
[ROW][C]Seasonal Period (s)[/C][C]12[/C][/ROW]
[ROW][C]Box-Cox transformation parameter (lambda) of Y series[/C][C]1[/C][/ROW]
[ROW][C]Degree of non-seasonal differencing (d) of Y series[/C][C]0[/C][/ROW]
[ROW][C]Degree of seasonal differencing (D) of Y series[/C][C]0[/C][/ROW]
[ROW][C]k[/C][C]rho(Y[t],X[t+k])[/C][/ROW]
[ROW][C]-14[/C][C]0.114078693818204[/C][/ROW]
[ROW][C]-13[/C][C]0.233485219019265[/C][/ROW]
[ROW][C]-12[/C][C]0.426700551174168[/C][/ROW]
[ROW][C]-11[/C][C]0.248144980491881[/C][/ROW]
[ROW][C]-10[/C][C]0.238943970833954[/C][/ROW]
[ROW][C]-9[/C][C]0.390686114467686[/C][/ROW]
[ROW][C]-8[/C][C]0.335020094975612[/C][/ROW]
[ROW][C]-7[/C][C]0.389252413710827[/C][/ROW]
[ROW][C]-6[/C][C]0.600889133887761[/C][/ROW]
[ROW][C]-5[/C][C]0.485169963236553[/C][/ROW]
[ROW][C]-4[/C][C]0.492211523287487[/C][/ROW]
[ROW][C]-3[/C][C]0.580497050468973[/C][/ROW]
[ROW][C]-2[/C][C]0.462526845277438[/C][/ROW]
[ROW][C]-1[/C][C]0.629153402101791[/C][/ROW]
[ROW][C]0[/C][C]0.912341023942634[/C][/ROW]
[ROW][C]1[/C][C]0.577090263940596[/C][/ROW]
[ROW][C]2[/C][C]0.495239939699384[/C][/ROW]
[ROW][C]3[/C][C]0.617731402194501[/C][/ROW]
[ROW][C]4[/C][C]0.499470912512376[/C][/ROW]
[ROW][C]5[/C][C]0.50381564861295[/C][/ROW]
[ROW][C]6[/C][C]0.62197704005522[/C][/ROW]
[ROW][C]7[/C][C]0.417579351828502[/C][/ROW]
[ROW][C]8[/C][C]0.373382368339701[/C][/ROW]
[ROW][C]9[/C][C]0.411841091049052[/C][/ROW]
[ROW][C]10[/C][C]0.2222724369044[/C][/ROW]
[ROW][C]11[/C][C]0.305397676751643[/C][/ROW]
[ROW][C]12[/C][C]0.468139050289122[/C][/ROW]
[ROW][C]13[/C][C]0.224500077535106[/C][/ROW]
[ROW][C]14[/C][C]0.196907763684439[/C][/ROW]
[/TABLE]
Source: https://freestatistics.org/blog/index.php?pk=27168&T=1

Globally Unique Identifier (entire table): ba.freestatistics.org/blog/index.php?pk=27168&T=1

As an alternative you can also use a QR Code:  

The GUIDs for individual cells are displayed in the table below:

Cross Correlation Function
ParameterValue
Box-Cox transformation parameter (lambda) of X series1
Degree of non-seasonal differencing (d) of X series0
Degree of seasonal differencing (D) of X series0
Seasonal Period (s)12
Box-Cox transformation parameter (lambda) of Y series1
Degree of non-seasonal differencing (d) of Y series0
Degree of seasonal differencing (D) of Y series0
krho(Y[t],X[t+k])
-140.114078693818204
-130.233485219019265
-120.426700551174168
-110.248144980491881
-100.238943970833954
-90.390686114467686
-80.335020094975612
-70.389252413710827
-60.600889133887761
-50.485169963236553
-40.492211523287487
-30.580497050468973
-20.462526845277438
-10.629153402101791
00.912341023942634
10.577090263940596
20.495239939699384
30.617731402194501
40.499470912512376
50.50381564861295
60.62197704005522
70.417579351828502
80.373382368339701
90.411841091049052
100.2222724369044
110.305397676751643
120.468139050289122
130.224500077535106
140.196907763684439


Parameters (Session):
par1 = 1 ; par2 = 0 ; par3 = 0 ; par4 = 12 ; par5 = 1 ; par6 = 0 ; par7 = 0 ;
Parameters (R input):
par1 = 1 ; par2 = 0 ; par3 = 0 ; par4 = 12 ; par5 = 1 ; par6 = 0 ; par7 = 0 ;
R code (references can be found in the software module):
par1 <- as.numeric(par1)
par2 <- as.numeric(par2)
par3 <- as.numeric(par3)
par4 <- as.numeric(par4)
par5 <- as.numeric(par5)
par6 <- as.numeric(par6)
par7 <- as.numeric(par7)
if (par1 == 0) {
x <- log(x)
} else {
x <- (x ^ par1 - 1) / par1
}
if (par5 == 0) {
y <- log(y)
} else {
y <- (y ^ par5 - 1) / par5
}
if (par2 > 0) x <- diff(x,lag=1,difference=par2)
if (par6 > 0) y <- diff(y,lag=1,difference=par6)
if (par3 > 0) x <- diff(x,lag=par4,difference=par3)
if (par7 > 0) y <- diff(y,lag=par4,difference=par7)
x
y
bitmap(file='test1.png')
(r <- ccf(x,y,main='Cross Correlation Function',ylab='CCF',xlab='Lag (k)'))
dev.off()
load(file='createtable')
a<-table.start()
a<-table.row.start(a)
a<-table.element(a,'Cross Correlation Function',2,TRUE)
a<-table.row.end(a)
a<-table.row.start(a)
a<-table.element(a,'Parameter',header=TRUE)
a<-table.element(a,'Value',header=TRUE)
a<-table.row.end(a)
a<-table.row.start(a)
a<-table.element(a,'Box-Cox transformation parameter (lambda) of X series',header=TRUE)
a<-table.element(a,par1)
a<-table.row.end(a)
a<-table.row.start(a)
a<-table.element(a,'Degree of non-seasonal differencing (d) of X series',header=TRUE)
a<-table.element(a,par2)
a<-table.row.end(a)
a<-table.row.start(a)
a<-table.element(a,'Degree of seasonal differencing (D) of X series',header=TRUE)
a<-table.element(a,par3)
a<-table.row.end(a)
a<-table.row.start(a)
a<-table.element(a,'Seasonal Period (s)',header=TRUE)
a<-table.element(a,par4)
a<-table.row.end(a)
a<-table.row.start(a)
a<-table.element(a,'Box-Cox transformation parameter (lambda) of Y series',header=TRUE)
a<-table.element(a,par5)
a<-table.row.end(a)
a<-table.row.start(a)
a<-table.element(a,'Degree of non-seasonal differencing (d) of Y series',header=TRUE)
a<-table.element(a,par6)
a<-table.row.end(a)
a<-table.row.start(a)
a<-table.element(a,'Degree of seasonal differencing (D) of Y series',header=TRUE)
a<-table.element(a,par7)
a<-table.row.end(a)
a<-table.row.start(a)
a<-table.element(a,'k',header=TRUE)
a<-table.element(a,'rho(Y[t],X[t+k])',header=TRUE)
a<-table.row.end(a)
mylength <- length(r$acf)
myhalf <- floor((mylength-1)/2)
for (i in 1:mylength) {
a<-table.row.start(a)
a<-table.element(a,i-myhalf-1,header=TRUE)
a<-table.element(a,r$acf[i])
a<-table.row.end(a)
}
a<-table.end(a)
table.save(a,file='mytable.tab')