Free Statistics

of Irreproducible Research!

Author's title

Author*The author of this computation has been verified*
R Software Modulerwasp_autocorrelation.wasp
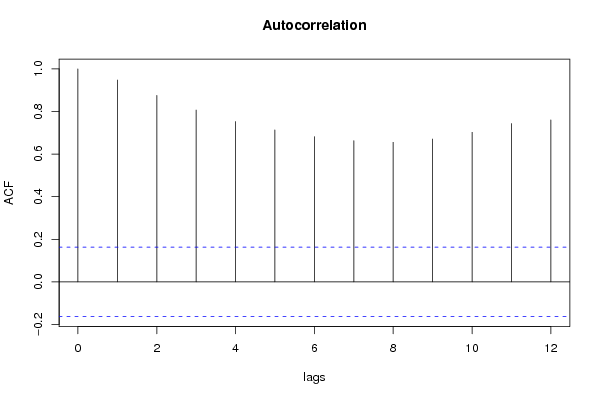
Title produced by software(Partial) Autocorrelation Function
Date of computationMon, 01 Dec 2008 10:22:25 -0700
Cite this page as followsStatistical Computations at FreeStatistics.org, Office for Research Development and Education, URL https://freestatistics.org/blog/index.php?v=date/2008/Dec/01/t1228152169ku8c6hhaa5t12sa.htm/, Retrieved Sun, 05 May 2024 20:17:21 +0000
Statistical Computations at FreeStatistics.org, Office for Research Development and Education, URL https://freestatistics.org/blog/index.php?pk=27014, Retrieved Sun, 05 May 2024 20:17:21 +0000
QR Codes:

Original text written by user:
IsPrivate?No (this computation is public)
User-defined keywords
Estimated Impact263
Family? (F = Feedback message, R = changed R code, M = changed R Module, P = changed Parameters, D = changed Data)
F     [Univariate Data Series] [Airline data] [2007-10-18 09:58:47] [42daae401fd3def69a25014f2252b4c2]
- RMPD  [Standard Deviation-Mean Plot] [Q5] [2008-11-29 20:10:39] [57fa5e3679c393aa19449b2f1be9928b]
-   P     [Standard Deviation-Mean Plot] [Q5] [2008-11-29 20:18:39] [57fa5e3679c393aa19449b2f1be9928b]
- RM        [Variance Reduction Matrix] [Q6 Variance] [2008-11-29 20:25:29] [57fa5e3679c393aa19449b2f1be9928b]
- RM          [(Partial) Autocorrelation Function] [Q6 ACF] [2008-11-29 20:35:57] [57fa5e3679c393aa19449b2f1be9928b]
-   P           [(Partial) Autocorrelation Function] [] [2008-11-30 11:08:30] [a4ee3bef49b119f4bd2e925060c84f5e]
F                 [(Partial) Autocorrelation Function] [] [2008-11-30 18:03:25] [4300be8b33fd3dcdacd2aa9800ceba23]
F                     [(Partial) Autocorrelation Function] [] [2008-12-01 17:22:25] [c0a347e3519123f7eef62b705326dad9] [Current]
Feedback Forum
2008-12-05 10:03:48 [Ciska Tanghe] [reply
Autocorrelation Function:

We passen eerst de ACF toe op de tijdreeks. We stellen het aantal time lags in op 36 om zo duidelijk seizoenaliteit te kunnen weergeven als deze er is. Lambda, d en D worden niet gewijzigd. Kijken we dan naar de grafiek ‘Autocorrelation’ dan zien we heel duidelijk een sterke correlatie.

http://www.freestatistics.org/blog/date/2008/Dec/01/t1228153172nj75ob01la7to8h.htm


Veranderen we nu d van 0 naar 1, dan bekomen we een andere oplossing. Kijken we nu naar de grafiek ‘Autocorrelation’ dan zien we geen duidelijk patroon. Wel zien we seizoenaliteit: lag 12, 24 en 36 vallen positief buiten het betrouwbaarheidsinterval en vertonen een langzaam dalende trend.

http://www.freestatistics.org/blog/date/2008/Dec/01/t1228153344c3gvrrsxpl9zi6z.htm

Veranderen we nu D van 0 naar 1, dan bekomen we nog een andere oplossing. Kijken we naar de grafiek ‘Autocorrelation’ dan zien we dat de seizoenaliteit verdwenen is.

http://www.freestatistics.org/blog/date/2008/Dec/01/t12281535505lf8w6bcl54z2v6.htm

Variance Reduction Matrix:

Vervolgens passen we de VRM toe op de tijdreeks. Ook hier gaan we op zoek naar de beste oplossing. De beste oplossing is waar de variantie het kleinst is. De variantie is het kleinst bij d=1 en D=1.

http://www.freestatistics.org/blog/date/2008/Dec/05/t1228471217xj3yqdneatwn235.htm

Spectrum:

We passen ook de Spectrum toe. De seasonal period stellen we in op 12 aangezien we met maandelijkse cijfers werken. Bij de berekening laten we d en D gelijk aan 0. Op de grafiek ‘Raw Periodogram’ zien we een dalende trend en grote schommelingen. Op de grafiek ‘Cumulative Periodogram’ zien we dat de tijdreeks een duidelijk patroon weergeeft.

http://www.freestatistics.org/blog/date/2008/Dec/01/t1228161466ae770nseymydoue.htm

Standard Deviation Mean Plot:

Om tot een goede oplossing te komen, bekijken we nog even de ‘Standard Deviaton-Mean Plot’ van de Airline datareeks. Ook hier stellen we de seasonal period in op 12 omwille van dezelfde reden eerder vermeld. In de derde tabel zien we dat we een lambda-waarde van -0.31 nodig hebben om de spreiding van de tijdreeks te neutraliseren.

http://www.freestatistics.org/blog/date/2008/Dec/01/t122816171107cxuq19x8zlr0q.htm

Conclusie:

De conclusie die we uit dit alles kunnen trekken, is dat zowel d als D gelijk moeten zijn aan 1 en dat de lambda-waarde gelijk moet zijn aan -0.31 om de tijdreeks te zuiveren van seizoenaliteit en een trend en om de spreiding van de tijdreeks te neutraliseren.
2008-12-07 14:55:03 [Roland Feldman] [reply
We kunnen dus besluiten dat een toename van de populatie een toename van seizonaliteit veroorzaakt en dus ook een toename van de standaard fout.

Om de spreiding te stabiliseren (en dus de standaard fout te stabiliseren) gebruiken we de Lambda
2008-12-09 07:45:54 [Bonifer Spillemaeckers] [reply
D en d worden hier eerst opnieuw gelijkgesteld aan 0. Het aantal lags zetten we hier op 36. Zo kunnen we toch meer aflezen op de grafiek. We zien hier duidelijk dat alle verticale lijnen buiten het betrouwbaarheidsinterval liggen. Dit kan dus te maken met een LT-trend.

Vervolgens stellen we d gelijk aan 1 en D aan 0. We kunnen duidelijk zien dat het probleem van de LT-trend toch grotendeels is opgelost. Wel zien we bij lag 12, 24 en 36 verscheidene pieken. Dit duidt duidelijk op seizoenaliteit.

Om de seizoenaliteit weg te werken, stellen we hier D gelijk aan 1. We zien nu dat bijna alle verticale lijnen binnen het betrouwbaarheidsinterval liggen. We zien dat er geen sprake meer is van seizoenaliteit en van een LT-trend.

Post a new message
Dataseries X:
112
118
132
129
121
135
148
148
136
119
104
118
115
126
141
135
125
149
170
170
158
133
114
140
145
150
178
163
172
178
199
199
184
162
146
166
171
180
193
181
183
218
230
242
209
191
172
194
196
196
236
235
229
243
264
272
237
211
180
201
204
188
235
227
234
264
302
293
259
229
203
229
242
233
267
269
270
315
364
347
312
274
237
278
284
277
317
313
318
374
413
405
355
306
271
306
315
301
356
348
355
422
465
467
404
347
305
336
340
318
362
348
363
435
491
505
404
359
310
337
360
342
406
396
420
472
548
559
463
407
362
405
417
391
419
461
472
535
622
606
508
461
390
432


Summary of computational transaction
Raw Inputview raw input (R code)
Raw Outputview raw output of R engine
Computing time1 seconds
R Server'Gwilym Jenkins' @ 72.249.127.135

\begin{tabular}{lllllllll}
\hline
Summary of computational transaction \tabularnewline
Raw Input & view raw input (R code)  \tabularnewline
Raw Output & view raw output of R engine  \tabularnewline
Computing time & 1 seconds \tabularnewline
R Server & 'Gwilym Jenkins' @ 72.249.127.135 \tabularnewline
\hline
\end{tabular}
%Source: https://freestatistics.org/blog/index.php?pk=27014&T=0

[TABLE]
[ROW][C]Summary of computational transaction[/C][/ROW]
[ROW][C]Raw Input[/C][C]view raw input (R code) [/C][/ROW]
[ROW][C]Raw Output[/C][C]view raw output of R engine [/C][/ROW]
[ROW][C]Computing time[/C][C]1 seconds[/C][/ROW]
[ROW][C]R Server[/C][C]'Gwilym Jenkins' @ 72.249.127.135[/C][/ROW]
[/TABLE]
Source: https://freestatistics.org/blog/index.php?pk=27014&T=0

Globally Unique Identifier (entire table): ba.freestatistics.org/blog/index.php?pk=27014&T=0

As an alternative you can also use a QR Code:  

The GUIDs for individual cells are displayed in the table below:

Summary of computational transaction
Raw Inputview raw input (R code)
Raw Outputview raw output of R engine
Computing time1 seconds
R Server'Gwilym Jenkins' @ 72.249.127.135


Autocorrelation Function
Time lag kACF(k)T-STATP-value
10.94804711.37660
20.87557510.50690
30.8066819.68020
40.7526259.03150
50.713778.56520
60.6817348.18080
70.6629047.95490
80.655617.86730
90.6709488.05140
100.702728.43260
110.743248.91890
120.7603959.12470

\begin{tabular}{lllllllll}
\hline
Autocorrelation Function \tabularnewline
Time lag k & ACF(k) & T-STAT & P-value \tabularnewline
1 & 0.948047 & 11.3766 & 0 \tabularnewline
2 & 0.875575 & 10.5069 & 0 \tabularnewline
3 & 0.806681 & 9.6802 & 0 \tabularnewline
4 & 0.752625 & 9.0315 & 0 \tabularnewline
5 & 0.71377 & 8.5652 & 0 \tabularnewline
6 & 0.681734 & 8.1808 & 0 \tabularnewline
7 & 0.662904 & 7.9549 & 0 \tabularnewline
8 & 0.65561 & 7.8673 & 0 \tabularnewline
9 & 0.670948 & 8.0514 & 0 \tabularnewline
10 & 0.70272 & 8.4326 & 0 \tabularnewline
11 & 0.74324 & 8.9189 & 0 \tabularnewline
12 & 0.760395 & 9.1247 & 0 \tabularnewline
\hline
\end{tabular}
%Source: https://freestatistics.org/blog/index.php?pk=27014&T=1

[TABLE]
[ROW][C]Autocorrelation Function[/C][/ROW]
[ROW][C]Time lag k[/C][C]ACF(k)[/C][C]T-STAT[/C][C]P-value[/C][/ROW]
[ROW][C]1[/C][C]0.948047[/C][C]11.3766[/C][C]0[/C][/ROW]
[ROW][C]2[/C][C]0.875575[/C][C]10.5069[/C][C]0[/C][/ROW]
[ROW][C]3[/C][C]0.806681[/C][C]9.6802[/C][C]0[/C][/ROW]
[ROW][C]4[/C][C]0.752625[/C][C]9.0315[/C][C]0[/C][/ROW]
[ROW][C]5[/C][C]0.71377[/C][C]8.5652[/C][C]0[/C][/ROW]
[ROW][C]6[/C][C]0.681734[/C][C]8.1808[/C][C]0[/C][/ROW]
[ROW][C]7[/C][C]0.662904[/C][C]7.9549[/C][C]0[/C][/ROW]
[ROW][C]8[/C][C]0.65561[/C][C]7.8673[/C][C]0[/C][/ROW]
[ROW][C]9[/C][C]0.670948[/C][C]8.0514[/C][C]0[/C][/ROW]
[ROW][C]10[/C][C]0.70272[/C][C]8.4326[/C][C]0[/C][/ROW]
[ROW][C]11[/C][C]0.74324[/C][C]8.9189[/C][C]0[/C][/ROW]
[ROW][C]12[/C][C]0.760395[/C][C]9.1247[/C][C]0[/C][/ROW]
[/TABLE]
Source: https://freestatistics.org/blog/index.php?pk=27014&T=1

Globally Unique Identifier (entire table): ba.freestatistics.org/blog/index.php?pk=27014&T=1

As an alternative you can also use a QR Code:  

The GUIDs for individual cells are displayed in the table below:

Autocorrelation Function
Time lag kACF(k)T-STATP-value
10.94804711.37660
20.87557510.50690
30.8066819.68020
40.7526259.03150
50.713778.56520
60.6817348.18080
70.6629047.95490
80.655617.86730
90.6709488.05140
100.702728.43260
110.743248.91890
120.7603959.12470


Partial Autocorrelation Function
Time lag kPACF(k)T-STATP-value
10.94804711.37660
2-0.229422-2.75310.003332
30.0381480.45780.323903
40.0937851.12540.131141
50.0736070.88330.189279
60.0077280.09270.463123
70.1255971.50720.066979
80.0899511.07940.141103
90.2324892.78990.002994
100.1660511.99260.024097
110.1712742.05530.020829
12-0.135431-1.62520.053156

\begin{tabular}{lllllllll}
\hline
Partial Autocorrelation Function \tabularnewline
Time lag k & PACF(k) & T-STAT & P-value \tabularnewline
1 & 0.948047 & 11.3766 & 0 \tabularnewline
2 & -0.229422 & -2.7531 & 0.003332 \tabularnewline
3 & 0.038148 & 0.4578 & 0.323903 \tabularnewline
4 & 0.093785 & 1.1254 & 0.131141 \tabularnewline
5 & 0.073607 & 0.8833 & 0.189279 \tabularnewline
6 & 0.007728 & 0.0927 & 0.463123 \tabularnewline
7 & 0.125597 & 1.5072 & 0.066979 \tabularnewline
8 & 0.089951 & 1.0794 & 0.141103 \tabularnewline
9 & 0.232489 & 2.7899 & 0.002994 \tabularnewline
10 & 0.166051 & 1.9926 & 0.024097 \tabularnewline
11 & 0.171274 & 2.0553 & 0.020829 \tabularnewline
12 & -0.135431 & -1.6252 & 0.053156 \tabularnewline
\hline
\end{tabular}
%Source: https://freestatistics.org/blog/index.php?pk=27014&T=2

[TABLE]
[ROW][C]Partial Autocorrelation Function[/C][/ROW]
[ROW][C]Time lag k[/C][C]PACF(k)[/C][C]T-STAT[/C][C]P-value[/C][/ROW]
[ROW][C]1[/C][C]0.948047[/C][C]11.3766[/C][C]0[/C][/ROW]
[ROW][C]2[/C][C]-0.229422[/C][C]-2.7531[/C][C]0.003332[/C][/ROW]
[ROW][C]3[/C][C]0.038148[/C][C]0.4578[/C][C]0.323903[/C][/ROW]
[ROW][C]4[/C][C]0.093785[/C][C]1.1254[/C][C]0.131141[/C][/ROW]
[ROW][C]5[/C][C]0.073607[/C][C]0.8833[/C][C]0.189279[/C][/ROW]
[ROW][C]6[/C][C]0.007728[/C][C]0.0927[/C][C]0.463123[/C][/ROW]
[ROW][C]7[/C][C]0.125597[/C][C]1.5072[/C][C]0.066979[/C][/ROW]
[ROW][C]8[/C][C]0.089951[/C][C]1.0794[/C][C]0.141103[/C][/ROW]
[ROW][C]9[/C][C]0.232489[/C][C]2.7899[/C][C]0.002994[/C][/ROW]
[ROW][C]10[/C][C]0.166051[/C][C]1.9926[/C][C]0.024097[/C][/ROW]
[ROW][C]11[/C][C]0.171274[/C][C]2.0553[/C][C]0.020829[/C][/ROW]
[ROW][C]12[/C][C]-0.135431[/C][C]-1.6252[/C][C]0.053156[/C][/ROW]
[/TABLE]
Source: https://freestatistics.org/blog/index.php?pk=27014&T=2

Globally Unique Identifier (entire table): ba.freestatistics.org/blog/index.php?pk=27014&T=2

As an alternative you can also use a QR Code:  

The GUIDs for individual cells are displayed in the table below:

Partial Autocorrelation Function
Time lag kPACF(k)T-STATP-value
10.94804711.37660
2-0.229422-2.75310.003332
30.0381480.45780.323903
40.0937851.12540.131141
50.0736070.88330.189279
60.0077280.09270.463123
70.1255971.50720.066979
80.0899511.07940.141103
90.2324892.78990.002994
100.1660511.99260.024097
110.1712742.05530.020829
12-0.135431-1.62520.053156


Parameters (Session):
par1 = 12 ; par2 = 1 ; par3 = 0 ; par4 = 0 ; par5 = 12 ;
Parameters (R input):
par1 = 12 ; par2 = 1 ; par3 = 0 ; par4 = 0 ; par5 = 12 ;
R code (references can be found in the software module):
if (par1 == 'Default') {
par1 = 10*log10(length(x))
} else {
par1 <- as.numeric(par1)
}
par2 <- as.numeric(par2)
par3 <- as.numeric(par3)
par4 <- as.numeric(par4)
par5 <- as.numeric(par5)
if (par2 == 0) {
x <- log(x)
} else {
x <- (x ^ par2 - 1) / par2
}
if (par3 > 0) x <- diff(x,lag=1,difference=par3)
if (par4 > 0) x <- diff(x,lag=par5,difference=par4)
bitmap(file='pic1.png')
racf <- acf(x,par1,main='Autocorrelation',xlab='lags',ylab='ACF')
dev.off()
bitmap(file='pic2.png')
rpacf <- pacf(x,par1,main='Partial Autocorrelation',xlab='lags',ylab='PACF')
dev.off()
(myacf <- c(racf$acf))
(mypacf <- c(rpacf$acf))
lengthx <- length(x)
sqrtn <- sqrt(lengthx)
load(file='createtable')
a<-table.start()
a<-table.row.start(a)
a<-table.element(a,'Autocorrelation Function',4,TRUE)
a<-table.row.end(a)
a<-table.row.start(a)
a<-table.element(a,'Time lag k',header=TRUE)
a<-table.element(a,hyperlink('basics.htm','ACF(k)','click here for more information about the Autocorrelation Function'),header=TRUE)
a<-table.element(a,'T-STAT',header=TRUE)
a<-table.element(a,'P-value',header=TRUE)
a<-table.row.end(a)
for (i in 2:(par1+1)) {
a<-table.row.start(a)
a<-table.element(a,i-1,header=TRUE)
a<-table.element(a,round(myacf[i],6))
mytstat <- myacf[i]*sqrtn
a<-table.element(a,round(mytstat,4))
a<-table.element(a,round(1-pt(abs(mytstat),lengthx),6))
a<-table.row.end(a)
}
a<-table.end(a)
table.save(a,file='mytable.tab')
a<-table.start()
a<-table.row.start(a)
a<-table.element(a,'Partial Autocorrelation Function',4,TRUE)
a<-table.row.end(a)
a<-table.row.start(a)
a<-table.element(a,'Time lag k',header=TRUE)
a<-table.element(a,hyperlink('basics.htm','PACF(k)','click here for more information about the Partial Autocorrelation Function'),header=TRUE)
a<-table.element(a,'T-STAT',header=TRUE)
a<-table.element(a,'P-value',header=TRUE)
a<-table.row.end(a)
for (i in 1:par1) {
a<-table.row.start(a)
a<-table.element(a,i,header=TRUE)
a<-table.element(a,round(mypacf[i],6))
mytstat <- mypacf[i]*sqrtn
a<-table.element(a,round(mytstat,4))
a<-table.element(a,round(1-pt(abs(mytstat),lengthx),6))
a<-table.row.end(a)
}
a<-table.end(a)
table.save(a,file='mytable1.tab')