Free Statistics

of Irreproducible Research!

Author's title

Author*The author of this computation has been verified*
R Software Modulerwasp_spectrum.wasp
Title produced by softwareSpectral Analysis
Date of computationMon, 01 Dec 2008 08:52:17 -0700
Cite this page as followsStatistical Computations at FreeStatistics.org, Office for Research Development and Education, URL https://freestatistics.org/blog/index.php?v=date/2008/Dec/01/t1228146782v9rvpdr5yu94idf.htm/, Retrieved Sun, 05 May 2024 14:37:51 +0000
Statistical Computations at FreeStatistics.org, Office for Research Development and Education, URL https://freestatistics.org/blog/index.php?pk=26958, Retrieved Sun, 05 May 2024 14:37:51 +0000
QR Codes:

Original text written by user:
IsPrivate?No (this computation is public)
User-defined keywords
Estimated Impact222
Family? (F = Feedback message, R = changed R code, M = changed R Module, P = changed Parameters, D = changed Data)
F     [Law of Averages] [Random Walk Simul...] [2008-11-25 18:40:39] [b98453cac15ba1066b407e146608df68]
F       [Law of Averages] [Random Walk Simul...] [2008-11-27 19:45:04] [58bf45a666dc5198906262e8815a9722]
F RMPD    [Standard Deviation-Mean Plot] [Standard Deviatio...] [2008-11-27 22:08:29] [58bf45a666dc5198906262e8815a9722]
- RMPD      [Spectral Analysis] [Spectral Analysis...] [2008-11-27 23:04:22] [58bf45a666dc5198906262e8815a9722]
F   P           [Spectral Analysis] [Q4] [2008-12-01 15:52:17] [7ed4ec9f8cdf7df79ef87b9dc09dff20] [Current]
Feedback Forum
2008-12-03 10:02:11 [Romina Machiels] [reply
Deze vraag werd correct beantwoord.
2008-12-08 18:10:35 [Jeroen Aerts] [reply
Volgens mij heb je een verkeerde bewerking uitgevoerd, aangezien de berekening het volgende resultaat zou moeten weergeven: Statistical Computations at FreeStatistics.org, Office for Research Development and Education, URL http://www.freestatistics.org/blog/date/2008/Dec/08/t122875972365i3oa4nz2ydpud.htm, Retrieved Mon, 08 Dec 2008 18:08:51 +0000


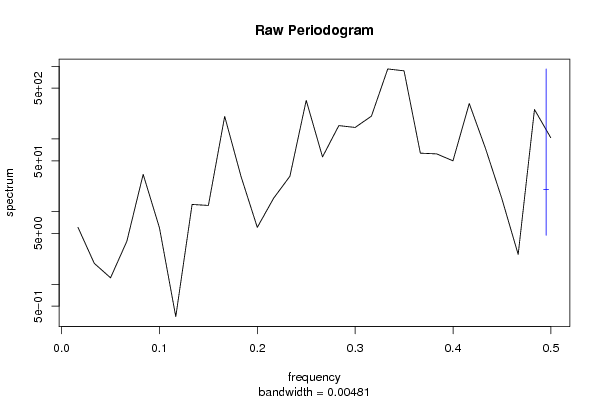
Het spectrum geeft een verband tussen de intensiteit van de onafhankelijke golfbewegingen van de reeks met hun frequentie.

Spectrum = amplitude / frequentie
Spectrum = amplitude / (1 /periode)
Spectrum = amplitude * periode

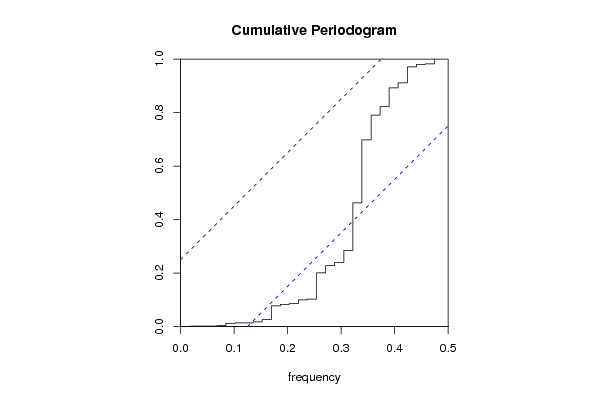
De hoogste spectrumwaarde is te zien bij een waarde 0.Het Cumulative Periodogram toont een verband tussen de cumulatieve intensiteit van de golven samen met de perioden.

Amplitude / periode
=> amplitude / (1/ frequentie)
=> amplitude * frequentie

Bij grote frequenties moeten de waarden in de grafiek dus ook groot zijn.
Via deze methode kunnen we controleren welke waarde van een bepaalde frequentie een bepaald aantal % van de reeks verklaard.
Is de frequentie 0, dan verklaren we niets. Is de frequentie 0,1 dan verklaren we bijna alles. Hieruit kunnen we afleiden dat wanneer de frequentie klein is, de periode groot (lang) zal zijn. We stelden eerder al dat een lange periode niet-seizoenale autocorrelatie impliceert. We bevestigen dus wederom onze eerdere bevindingen.
2008-12-08 18:33:39 [Yara Van Overstraeten] [reply
Hier werd inderdaad de verkeerde berekening gemaakt.
Jeroen heeft de correcte berekening geblogt.

Post a new message
Dataseries X:
101
88
108
116
104
110
105
107
124
109
102
125
102
101
116
114
115
119
108
110
120
113
111
121
99
104
117
108
122
122
111
111
131
108
118
119
104
105
118
124
123
114
119
116
129
112
123
124
117
110
118
135
127
117
137
130
132
142
122
126


Summary of computational transaction
Raw Inputview raw input (R code)
Raw Outputview raw output of R engine
Computing time1 seconds
R Server'George Udny Yule' @ 72.249.76.132

\begin{tabular}{lllllllll}
\hline
Summary of computational transaction \tabularnewline
Raw Input & view raw input (R code)  \tabularnewline
Raw Output & view raw output of R engine  \tabularnewline
Computing time & 1 seconds \tabularnewline
R Server & 'George Udny Yule' @ 72.249.76.132 \tabularnewline
\hline
\end{tabular}
%Source: https://freestatistics.org/blog/index.php?pk=26958&T=0

[TABLE]
[ROW][C]Summary of computational transaction[/C][/ROW]
[ROW][C]Raw Input[/C][C]view raw input (R code) [/C][/ROW]
[ROW][C]Raw Output[/C][C]view raw output of R engine [/C][/ROW]
[ROW][C]Computing time[/C][C]1 seconds[/C][/ROW]
[ROW][C]R Server[/C][C]'George Udny Yule' @ 72.249.76.132[/C][/ROW]
[/TABLE]
Source: https://freestatistics.org/blog/index.php?pk=26958&T=0

Globally Unique Identifier (entire table): ba.freestatistics.org/blog/index.php?pk=26958&T=0

As an alternative you can also use a QR Code:  

The GUIDs for individual cells are displayed in the table below:

Summary of computational transaction
Raw Inputview raw input (R code)
Raw Outputview raw output of R engine
Computing time1 seconds
R Server'George Udny Yule' @ 72.249.76.132


Raw Periodogram
ParameterValue
Box-Cox transformation parameter (lambda)1
Degree of non-seasonal differencing (d)1
Degree of seasonal differencing (D)0
Seasonal Period (s)12
Frequency (Period)Spectrum
0.0167 (60)6.082551
0.0333 (30)1.941143
0.05 (20)1.226396
0.0667 (15)3.919919
0.0833 (12)32.602553
0.1 (10)5.970416
0.1167 (8.5714)0.358131
0.1333 (7.5)12.544647
0.15 (6.6667)12.157077
0.1667 (6)204.748373
0.1833 (5.4545)30.555585
0.2 (5)6.064001
0.2167 (4.6154)15.27164
0.2333 (4.2857)30.700182
0.25 (4)340.142319
0.2667 (3.75)56.630993
0.2833 (3.5294)152.753931
0.3 (3.3333)144.004398
0.3167 (3.1579)206.112155
0.3333 (3)919.831219
0.35 (2.8571)866.842121
0.3667 (2.7273)63.740289
0.3833 (2.6087)62.33013
0.4 (2.5)50.016858
0.4167 (2.4)307.692014
0.4333 (2.3077)73.627839
0.45 (2.2222)15.078035
0.4667 (2.1429)2.573648
0.4833 (2.069)254.401028
0.5 (2)103.952847

\begin{tabular}{lllllllll}
\hline
Raw Periodogram \tabularnewline
Parameter & Value \tabularnewline
Box-Cox transformation parameter (lambda) & 1 \tabularnewline
Degree of non-seasonal differencing (d) & 1 \tabularnewline
Degree of seasonal differencing (D) & 0 \tabularnewline
Seasonal Period (s) & 12 \tabularnewline
Frequency (Period) & Spectrum \tabularnewline
0.0167 (60) & 6.082551 \tabularnewline
0.0333 (30) & 1.941143 \tabularnewline
0.05 (20) & 1.226396 \tabularnewline
0.0667 (15) & 3.919919 \tabularnewline
0.0833 (12) & 32.602553 \tabularnewline
0.1 (10) & 5.970416 \tabularnewline
0.1167 (8.5714) & 0.358131 \tabularnewline
0.1333 (7.5) & 12.544647 \tabularnewline
0.15 (6.6667) & 12.157077 \tabularnewline
0.1667 (6) & 204.748373 \tabularnewline
0.1833 (5.4545) & 30.555585 \tabularnewline
0.2 (5) & 6.064001 \tabularnewline
0.2167 (4.6154) & 15.27164 \tabularnewline
0.2333 (4.2857) & 30.700182 \tabularnewline
0.25 (4) & 340.142319 \tabularnewline
0.2667 (3.75) & 56.630993 \tabularnewline
0.2833 (3.5294) & 152.753931 \tabularnewline
0.3 (3.3333) & 144.004398 \tabularnewline
0.3167 (3.1579) & 206.112155 \tabularnewline
0.3333 (3) & 919.831219 \tabularnewline
0.35 (2.8571) & 866.842121 \tabularnewline
0.3667 (2.7273) & 63.740289 \tabularnewline
0.3833 (2.6087) & 62.33013 \tabularnewline
0.4 (2.5) & 50.016858 \tabularnewline
0.4167 (2.4) & 307.692014 \tabularnewline
0.4333 (2.3077) & 73.627839 \tabularnewline
0.45 (2.2222) & 15.078035 \tabularnewline
0.4667 (2.1429) & 2.573648 \tabularnewline
0.4833 (2.069) & 254.401028 \tabularnewline
0.5 (2) & 103.952847 \tabularnewline
\hline
\end{tabular}
%Source: https://freestatistics.org/blog/index.php?pk=26958&T=1

[TABLE]
[ROW][C]Raw Periodogram[/C][/ROW]
[ROW][C]Parameter[/C][C]Value[/C][/ROW]
[ROW][C]Box-Cox transformation parameter (lambda)[/C][C]1[/C][/ROW]
[ROW][C]Degree of non-seasonal differencing (d)[/C][C]1[/C][/ROW]
[ROW][C]Degree of seasonal differencing (D)[/C][C]0[/C][/ROW]
[ROW][C]Seasonal Period (s)[/C][C]12[/C][/ROW]
[ROW][C]Frequency (Period)[/C][C]Spectrum[/C][/ROW]
[ROW][C]0.0167 (60)[/C][C]6.082551[/C][/ROW]
[ROW][C]0.0333 (30)[/C][C]1.941143[/C][/ROW]
[ROW][C]0.05 (20)[/C][C]1.226396[/C][/ROW]
[ROW][C]0.0667 (15)[/C][C]3.919919[/C][/ROW]
[ROW][C]0.0833 (12)[/C][C]32.602553[/C][/ROW]
[ROW][C]0.1 (10)[/C][C]5.970416[/C][/ROW]
[ROW][C]0.1167 (8.5714)[/C][C]0.358131[/C][/ROW]
[ROW][C]0.1333 (7.5)[/C][C]12.544647[/C][/ROW]
[ROW][C]0.15 (6.6667)[/C][C]12.157077[/C][/ROW]
[ROW][C]0.1667 (6)[/C][C]204.748373[/C][/ROW]
[ROW][C]0.1833 (5.4545)[/C][C]30.555585[/C][/ROW]
[ROW][C]0.2 (5)[/C][C]6.064001[/C][/ROW]
[ROW][C]0.2167 (4.6154)[/C][C]15.27164[/C][/ROW]
[ROW][C]0.2333 (4.2857)[/C][C]30.700182[/C][/ROW]
[ROW][C]0.25 (4)[/C][C]340.142319[/C][/ROW]
[ROW][C]0.2667 (3.75)[/C][C]56.630993[/C][/ROW]
[ROW][C]0.2833 (3.5294)[/C][C]152.753931[/C][/ROW]
[ROW][C]0.3 (3.3333)[/C][C]144.004398[/C][/ROW]
[ROW][C]0.3167 (3.1579)[/C][C]206.112155[/C][/ROW]
[ROW][C]0.3333 (3)[/C][C]919.831219[/C][/ROW]
[ROW][C]0.35 (2.8571)[/C][C]866.842121[/C][/ROW]
[ROW][C]0.3667 (2.7273)[/C][C]63.740289[/C][/ROW]
[ROW][C]0.3833 (2.6087)[/C][C]62.33013[/C][/ROW]
[ROW][C]0.4 (2.5)[/C][C]50.016858[/C][/ROW]
[ROW][C]0.4167 (2.4)[/C][C]307.692014[/C][/ROW]
[ROW][C]0.4333 (2.3077)[/C][C]73.627839[/C][/ROW]
[ROW][C]0.45 (2.2222)[/C][C]15.078035[/C][/ROW]
[ROW][C]0.4667 (2.1429)[/C][C]2.573648[/C][/ROW]
[ROW][C]0.4833 (2.069)[/C][C]254.401028[/C][/ROW]
[ROW][C]0.5 (2)[/C][C]103.952847[/C][/ROW]
[/TABLE]
Source: https://freestatistics.org/blog/index.php?pk=26958&T=1

Globally Unique Identifier (entire table): ba.freestatistics.org/blog/index.php?pk=26958&T=1

As an alternative you can also use a QR Code:  

The GUIDs for individual cells are displayed in the table below:

Raw Periodogram
ParameterValue
Box-Cox transformation parameter (lambda)1
Degree of non-seasonal differencing (d)1
Degree of seasonal differencing (D)0
Seasonal Period (s)12
Frequency (Period)Spectrum
0.0167 (60)6.082551
0.0333 (30)1.941143
0.05 (20)1.226396
0.0667 (15)3.919919
0.0833 (12)32.602553
0.1 (10)5.970416
0.1167 (8.5714)0.358131
0.1333 (7.5)12.544647
0.15 (6.6667)12.157077
0.1667 (6)204.748373
0.1833 (5.4545)30.555585
0.2 (5)6.064001
0.2167 (4.6154)15.27164
0.2333 (4.2857)30.700182
0.25 (4)340.142319
0.2667 (3.75)56.630993
0.2833 (3.5294)152.753931
0.3 (3.3333)144.004398
0.3167 (3.1579)206.112155
0.3333 (3)919.831219
0.35 (2.8571)866.842121
0.3667 (2.7273)63.740289
0.3833 (2.6087)62.33013
0.4 (2.5)50.016858
0.4167 (2.4)307.692014
0.4333 (2.3077)73.627839
0.45 (2.2222)15.078035
0.4667 (2.1429)2.573648
0.4833 (2.069)254.401028
0.5 (2)103.952847


Parameters (Session):
par1 = 1 ; par2 = 1 ; par3 = 0 ; par4 = 12 ;
Parameters (R input):
par1 = 1 ; par2 = 1 ; par3 = 0 ; par4 = 12 ;
R code (references can be found in the software module):
par1 <- as.numeric(par1)
par2 <- as.numeric(par2)
par3 <- as.numeric(par3)
par4 <- as.numeric(par4)
if (par1 == 0) {
x <- log(x)
} else {
x <- (x ^ par1 - 1) / par1
}
if (par2 > 0) x <- diff(x,lag=1,difference=par2)
if (par3 > 0) x <- diff(x,lag=par4,difference=par3)
bitmap(file='test1.png')
r <- spectrum(x,main='Raw Periodogram')
dev.off()
bitmap(file='test2.png')
cpgram(x,main='Cumulative Periodogram')
dev.off()
load(file='createtable')
a<-table.start()
a<-table.row.start(a)
a<-table.element(a,'Raw Periodogram',2,TRUE)
a<-table.row.end(a)
a<-table.row.start(a)
a<-table.element(a,'Parameter',header=TRUE)
a<-table.element(a,'Value',header=TRUE)
a<-table.row.end(a)
a<-table.row.start(a)
a<-table.element(a,'Box-Cox transformation parameter (lambda)',header=TRUE)
a<-table.element(a,par1)
a<-table.row.end(a)
a<-table.row.start(a)
a<-table.element(a,'Degree of non-seasonal differencing (d)',header=TRUE)
a<-table.element(a,par2)
a<-table.row.end(a)
a<-table.row.start(a)
a<-table.element(a,'Degree of seasonal differencing (D)',header=TRUE)
a<-table.element(a,par3)
a<-table.row.end(a)
a<-table.row.start(a)
a<-table.element(a,'Seasonal Period (s)',header=TRUE)
a<-table.element(a,par4)
a<-table.row.end(a)
a<-table.row.start(a)
a<-table.element(a,'Frequency (Period)',header=TRUE)
a<-table.element(a,'Spectrum',header=TRUE)
a<-table.row.end(a)
for (i in 1:length(r$freq)) {
a<-table.row.start(a)
mylab <- round(r$freq[i],4)
mylab <- paste(mylab,' (',sep='')
mylab <- paste(mylab,round(1/r$freq[i],4),sep='')
mylab <- paste(mylab,')',sep='')
a<-table.element(a,mylab,header=TRUE)
a<-table.element(a,round(r$spec[i],6))
a<-table.row.end(a)
}
a<-table.end(a)
table.save(a,file='mytable.tab')