Free Statistics

of Irreproducible Research!

Author's title

Author*Unverified author*
R Software Modulerwasp_spectrum.wasp
Title produced by softwareSpectral Analysis
Date of computationMon, 01 Dec 2008 08:46:23 -0700
Cite this page as followsStatistical Computations at FreeStatistics.org, Office for Research Development and Education, URL https://freestatistics.org/blog/index.php?v=date/2008/Dec/01/t1228146410ruhj4dow3bm4jof.htm/, Retrieved Sun, 05 May 2024 17:18:16 +0000
Statistical Computations at FreeStatistics.org, Office for Research Development and Education, URL https://freestatistics.org/blog/index.php?pk=26954, Retrieved Sun, 05 May 2024 17:18:16 +0000
QR Codes:

Original text written by user:
IsPrivate?No (this computation is public)
User-defined keywords
Estimated Impact245
Family? (F = Feedback message, R = changed R code, M = changed R Module, P = changed Parameters, D = changed Data)
F     [Law of Averages] [Random Walk Simul...] [2008-11-25 18:40:39] [b98453cac15ba1066b407e146608df68]
F       [Law of Averages] [Random Walk Simul...] [2008-11-27 19:45:04] [58bf45a666dc5198906262e8815a9722]
F RMPD    [Standard Deviation-Mean Plot] [Standard Deviatio...] [2008-11-27 22:08:29] [58bf45a666dc5198906262e8815a9722]
- RMPD      [Spectral Analysis] [Spectral Analysis...] [2008-11-27 23:04:22] [58bf45a666dc5198906262e8815a9722]
F R P           [Spectral Analysis] [Q4] [2008-12-01 15:46:23] [461be1b9ba57453336a7ea3097b7d5b5] [Current]
Feedback Forum
2008-12-08 15:13:20 [Mehmet Yilmaz] [reply
De student heeft een foute berekening gemaakt.
Hij heeft een 'Spectral analysis' uitgevoerd terwijl het een 'Law of Averages' reproductie moest zijn.

Conclusie:
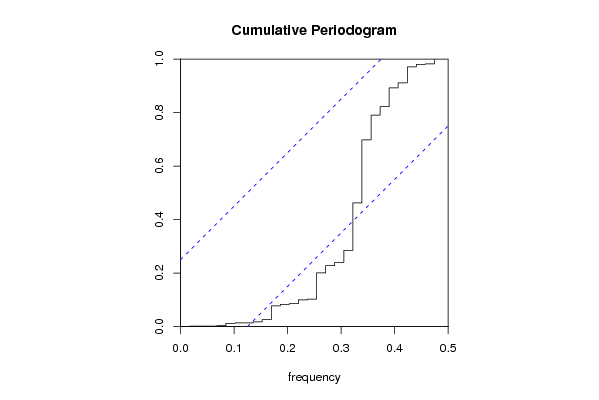
Bij het 1ste grafiek (cum. periodgram) zien we een zeer steile stijging langs de linkerkant wat wijst op een lange termijntrend.
Als er een lijn tussen de stippellijnen ging, dan zou er geen sprake zijn van een patroon.

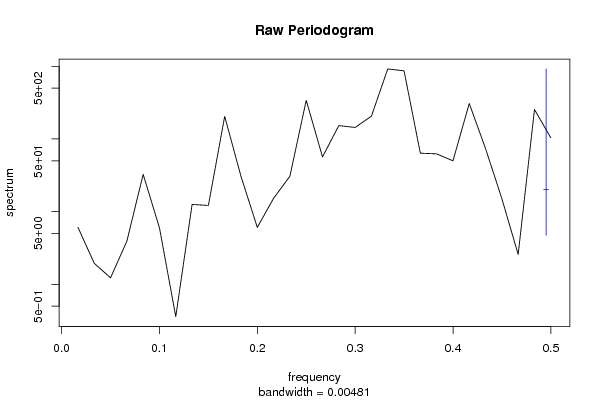
Ook bij de Raw Periodgram wijst het grote aantal van lage frequenties, steeds wederkerend, op een lange termijn effect.

Op de X-as kunnen we de frequentie aflezen. Op de linker helft gaat het snel op en neer en op de rechterhelft traag. Links komen de golfbewegingen het sterkst voor, wat erop wijst dat het dominant is in de tijd. Waar het traag op en neer gaat, kunnen we spreken van trendmatigheid.
2008-12-08 15:15:04 [Mehmet Yilmaz] [reply
De juiste berekening:

http://www.freestatistics.org/blog/index.php?v=date/2008/Dec/08/t1228749282t0ey26k6m4u50x5.htm
2008-12-08 19:49:01 [David Buelens] [reply
Hier is inderdaad een foutieve module gebruikt. Ook valt me op dat de blog niet correct is gedaan, omdat de auteur niet bekend is.

http://www.freestatistics.org/blog/date/2008/Nov/29/t1227963571eayuhltk6pp63bl.htm

grafiek, law of averages:

Excess of heads: Op elk moment is er een 50% kans dat kop gegooid wordt. Dit geeft het stijgende en dalende verloop van de eerste grafiek die het aantal gegooid aantal kop volgt. Het patroon komt hier vooral omdat enkel aantal kop gevolgd wordt en het niet gooien van kop de grafiek zal doen dalen.
Proportion of heads: Op deze grafiek kan men aflezen dat het aantal gegooid aantal kop en munt aan elkaar gelijk zijn na een aantal worpen, en deze grafiek duidelijk vlakker verloopt.

Post a new message
Dataseries X:
101
88
108
116
104
110
105
107
124
109
102
125
102
101
116
114
115
119
108
110
120
113
111
121
99
104
117
108
122
122
111
111
131
108
118
119
104
105
118
124
123
114
119
116
129
112
123
124
117
110
118
135
127
117
137
130
132
142
122
126


Summary of computational transaction
Raw Inputview raw input (R code)
Raw Outputview raw output of R engine
Computing time1 seconds
R Server'Gwilym Jenkins' @ 72.249.127.135

\begin{tabular}{lllllllll}
\hline
Summary of computational transaction \tabularnewline
Raw Input & view raw input (R code)  \tabularnewline
Raw Output & view raw output of R engine  \tabularnewline
Computing time & 1 seconds \tabularnewline
R Server & 'Gwilym Jenkins' @ 72.249.127.135 \tabularnewline
\hline
\end{tabular}
%Source: https://freestatistics.org/blog/index.php?pk=26954&T=0

[TABLE]
[ROW][C]Summary of computational transaction[/C][/ROW]
[ROW][C]Raw Input[/C][C]view raw input (R code) [/C][/ROW]
[ROW][C]Raw Output[/C][C]view raw output of R engine [/C][/ROW]
[ROW][C]Computing time[/C][C]1 seconds[/C][/ROW]
[ROW][C]R Server[/C][C]'Gwilym Jenkins' @ 72.249.127.135[/C][/ROW]
[/TABLE]
Source: https://freestatistics.org/blog/index.php?pk=26954&T=0

Globally Unique Identifier (entire table): ba.freestatistics.org/blog/index.php?pk=26954&T=0

As an alternative you can also use a QR Code:  

The GUIDs for individual cells are displayed in the table below:

Summary of computational transaction
Raw Inputview raw input (R code)
Raw Outputview raw output of R engine
Computing time1 seconds
R Server'Gwilym Jenkins' @ 72.249.127.135


Raw Periodogram
ParameterValue
Box-Cox transformation parameter (lambda)1
Degree of non-seasonal differencing (d)1
Degree of seasonal differencing (D)0
Seasonal Period (s)12
Frequency (Period)Spectrum
0.0167 (60)6.082551
0.0333 (30)1.941143
0.05 (20)1.226396
0.0667 (15)3.919919
0.0833 (12)32.602553
0.1 (10)5.970416
0.1167 (8.5714)0.358131
0.1333 (7.5)12.544647
0.15 (6.6667)12.157077
0.1667 (6)204.748373
0.1833 (5.4545)30.555585
0.2 (5)6.064001
0.2167 (4.6154)15.27164
0.2333 (4.2857)30.700182
0.25 (4)340.142319
0.2667 (3.75)56.630993
0.2833 (3.5294)152.753931
0.3 (3.3333)144.004398
0.3167 (3.1579)206.112155
0.3333 (3)919.831219
0.35 (2.8571)866.842121
0.3667 (2.7273)63.740289
0.3833 (2.6087)62.33013
0.4 (2.5)50.016858
0.4167 (2.4)307.692014
0.4333 (2.3077)73.627839
0.45 (2.2222)15.078035
0.4667 (2.1429)2.573648
0.4833 (2.069)254.401028
0.5 (2)103.952847

\begin{tabular}{lllllllll}
\hline
Raw Periodogram \tabularnewline
Parameter & Value \tabularnewline
Box-Cox transformation parameter (lambda) & 1 \tabularnewline
Degree of non-seasonal differencing (d) & 1 \tabularnewline
Degree of seasonal differencing (D) & 0 \tabularnewline
Seasonal Period (s) & 12 \tabularnewline
Frequency (Period) & Spectrum \tabularnewline
0.0167 (60) & 6.082551 \tabularnewline
0.0333 (30) & 1.941143 \tabularnewline
0.05 (20) & 1.226396 \tabularnewline
0.0667 (15) & 3.919919 \tabularnewline
0.0833 (12) & 32.602553 \tabularnewline
0.1 (10) & 5.970416 \tabularnewline
0.1167 (8.5714) & 0.358131 \tabularnewline
0.1333 (7.5) & 12.544647 \tabularnewline
0.15 (6.6667) & 12.157077 \tabularnewline
0.1667 (6) & 204.748373 \tabularnewline
0.1833 (5.4545) & 30.555585 \tabularnewline
0.2 (5) & 6.064001 \tabularnewline
0.2167 (4.6154) & 15.27164 \tabularnewline
0.2333 (4.2857) & 30.700182 \tabularnewline
0.25 (4) & 340.142319 \tabularnewline
0.2667 (3.75) & 56.630993 \tabularnewline
0.2833 (3.5294) & 152.753931 \tabularnewline
0.3 (3.3333) & 144.004398 \tabularnewline
0.3167 (3.1579) & 206.112155 \tabularnewline
0.3333 (3) & 919.831219 \tabularnewline
0.35 (2.8571) & 866.842121 \tabularnewline
0.3667 (2.7273) & 63.740289 \tabularnewline
0.3833 (2.6087) & 62.33013 \tabularnewline
0.4 (2.5) & 50.016858 \tabularnewline
0.4167 (2.4) & 307.692014 \tabularnewline
0.4333 (2.3077) & 73.627839 \tabularnewline
0.45 (2.2222) & 15.078035 \tabularnewline
0.4667 (2.1429) & 2.573648 \tabularnewline
0.4833 (2.069) & 254.401028 \tabularnewline
0.5 (2) & 103.952847 \tabularnewline
\hline
\end{tabular}
%Source: https://freestatistics.org/blog/index.php?pk=26954&T=1

[TABLE]
[ROW][C]Raw Periodogram[/C][/ROW]
[ROW][C]Parameter[/C][C]Value[/C][/ROW]
[ROW][C]Box-Cox transformation parameter (lambda)[/C][C]1[/C][/ROW]
[ROW][C]Degree of non-seasonal differencing (d)[/C][C]1[/C][/ROW]
[ROW][C]Degree of seasonal differencing (D)[/C][C]0[/C][/ROW]
[ROW][C]Seasonal Period (s)[/C][C]12[/C][/ROW]
[ROW][C]Frequency (Period)[/C][C]Spectrum[/C][/ROW]
[ROW][C]0.0167 (60)[/C][C]6.082551[/C][/ROW]
[ROW][C]0.0333 (30)[/C][C]1.941143[/C][/ROW]
[ROW][C]0.05 (20)[/C][C]1.226396[/C][/ROW]
[ROW][C]0.0667 (15)[/C][C]3.919919[/C][/ROW]
[ROW][C]0.0833 (12)[/C][C]32.602553[/C][/ROW]
[ROW][C]0.1 (10)[/C][C]5.970416[/C][/ROW]
[ROW][C]0.1167 (8.5714)[/C][C]0.358131[/C][/ROW]
[ROW][C]0.1333 (7.5)[/C][C]12.544647[/C][/ROW]
[ROW][C]0.15 (6.6667)[/C][C]12.157077[/C][/ROW]
[ROW][C]0.1667 (6)[/C][C]204.748373[/C][/ROW]
[ROW][C]0.1833 (5.4545)[/C][C]30.555585[/C][/ROW]
[ROW][C]0.2 (5)[/C][C]6.064001[/C][/ROW]
[ROW][C]0.2167 (4.6154)[/C][C]15.27164[/C][/ROW]
[ROW][C]0.2333 (4.2857)[/C][C]30.700182[/C][/ROW]
[ROW][C]0.25 (4)[/C][C]340.142319[/C][/ROW]
[ROW][C]0.2667 (3.75)[/C][C]56.630993[/C][/ROW]
[ROW][C]0.2833 (3.5294)[/C][C]152.753931[/C][/ROW]
[ROW][C]0.3 (3.3333)[/C][C]144.004398[/C][/ROW]
[ROW][C]0.3167 (3.1579)[/C][C]206.112155[/C][/ROW]
[ROW][C]0.3333 (3)[/C][C]919.831219[/C][/ROW]
[ROW][C]0.35 (2.8571)[/C][C]866.842121[/C][/ROW]
[ROW][C]0.3667 (2.7273)[/C][C]63.740289[/C][/ROW]
[ROW][C]0.3833 (2.6087)[/C][C]62.33013[/C][/ROW]
[ROW][C]0.4 (2.5)[/C][C]50.016858[/C][/ROW]
[ROW][C]0.4167 (2.4)[/C][C]307.692014[/C][/ROW]
[ROW][C]0.4333 (2.3077)[/C][C]73.627839[/C][/ROW]
[ROW][C]0.45 (2.2222)[/C][C]15.078035[/C][/ROW]
[ROW][C]0.4667 (2.1429)[/C][C]2.573648[/C][/ROW]
[ROW][C]0.4833 (2.069)[/C][C]254.401028[/C][/ROW]
[ROW][C]0.5 (2)[/C][C]103.952847[/C][/ROW]
[/TABLE]
Source: https://freestatistics.org/blog/index.php?pk=26954&T=1

Globally Unique Identifier (entire table): ba.freestatistics.org/blog/index.php?pk=26954&T=1

As an alternative you can also use a QR Code:  

The GUIDs for individual cells are displayed in the table below:

Raw Periodogram
ParameterValue
Box-Cox transformation parameter (lambda)1
Degree of non-seasonal differencing (d)1
Degree of seasonal differencing (D)0
Seasonal Period (s)12
Frequency (Period)Spectrum
0.0167 (60)6.082551
0.0333 (30)1.941143
0.05 (20)1.226396
0.0667 (15)3.919919
0.0833 (12)32.602553
0.1 (10)5.970416
0.1167 (8.5714)0.358131
0.1333 (7.5)12.544647
0.15 (6.6667)12.157077
0.1667 (6)204.748373
0.1833 (5.4545)30.555585
0.2 (5)6.064001
0.2167 (4.6154)15.27164
0.2333 (4.2857)30.700182
0.25 (4)340.142319
0.2667 (3.75)56.630993
0.2833 (3.5294)152.753931
0.3 (3.3333)144.004398
0.3167 (3.1579)206.112155
0.3333 (3)919.831219
0.35 (2.8571)866.842121
0.3667 (2.7273)63.740289
0.3833 (2.6087)62.33013
0.4 (2.5)50.016858
0.4167 (2.4)307.692014
0.4333 (2.3077)73.627839
0.45 (2.2222)15.078035
0.4667 (2.1429)2.573648
0.4833 (2.069)254.401028
0.5 (2)103.952847


Parameters (Session):
par1 = 1 ; par2 = 1 ; par3 = 0 ; par4 = 12 ;
Parameters (R input):
par1 = 1 ; par2 = 1 ; par3 = 0 ; par4 = 12 ;
R code (references can be found in the software module):
par1 <- as.numeric(par1)
par2 <- as.numeric(par2)
par3 <- as.numeric(par3)
par4 <- as.numeric(par4)
if (par1 == 0) {
x <- log(x)
} else {
x <- (x ^ par1 - 1) / par1
}
if (par2 > 0) x <- diff(x,lag=1,difference=par2)
if (par3 > 0) x <- diff(x,lag=par4,difference=par3)
bitmap(file='test1.png')
r <- spectrum(x,main='Raw Periodogram')
dev.off()
bitmap(file='test2.png')
cpgram(x,main='Cumulative Periodogram')
dev.off()
load(file='createtable')
a<-table.start()
a<-table.row.start(a)
a<-table.element(a,'Raw Periodogram',2,TRUE)
a<-table.row.end(a)
a<-table.row.start(a)
a<-table.element(a,'Parameter',header=TRUE)
a<-table.element(a,'Value',header=TRUE)
a<-table.row.end(a)
a<-table.row.start(a)
a<-table.element(a,'Box-Cox transformation parameter (lambda)',header=TRUE)
a<-table.element(a,par1)
a<-table.row.end(a)
a<-table.row.start(a)
a<-table.element(a,'Degree of non-seasonal differencing (d)',header=TRUE)
a<-table.element(a,par2)
a<-table.row.end(a)
a<-table.row.start(a)
a<-table.element(a,'Degree of seasonal differencing (D)',header=TRUE)
a<-table.element(a,par3)
a<-table.row.end(a)
a<-table.row.start(a)
a<-table.element(a,'Seasonal Period (s)',header=TRUE)
a<-table.element(a,par4)
a<-table.row.end(a)
a<-table.row.start(a)
a<-table.element(a,'Frequency (Period)',header=TRUE)
a<-table.element(a,'Spectrum',header=TRUE)
a<-table.row.end(a)
for (i in 1:length(r$freq)) {
a<-table.row.start(a)
mylab <- round(r$freq[i],4)
mylab <- paste(mylab,' (',sep='')
mylab <- paste(mylab,round(1/r$freq[i],4),sep='')
mylab <- paste(mylab,')',sep='')
a<-table.element(a,mylab,header=TRUE)
a<-table.element(a,round(r$spec[i],6))
a<-table.row.end(a)
}
a<-table.end(a)
table.save(a,file='mytable.tab')