| ANOVA Model | ||||
| Response ~ Treatment_A * Treatment_B | ||||
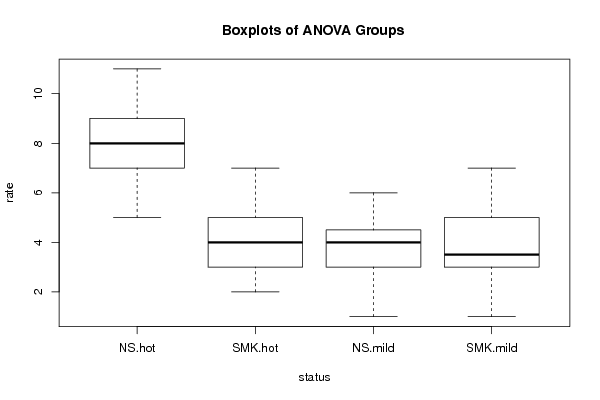
| means | 8.1 | -3.95 | -4.45 | 4.1 |
| ANOVA Statistics | |||||
| Df | Sum Sq | Mean Sq | F value | Pr(>F) | |
| 1 | |||||
| Treatment_A | 1 | 72.2 | 72.2 | 31.884 | 0 |
| Treatment_B | 1 | 115.2 | 115.2 | 50.873 | 0 |
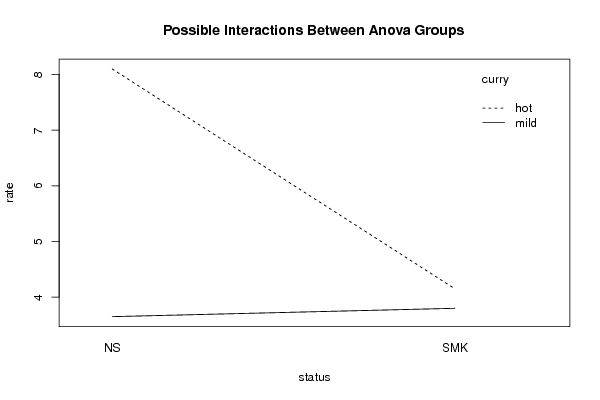
| Treatment_A:Treatment_B | 1 | 84.05 | 84.05 | 37.117 | 0 |
| Residuals | 76 | 172.1 | 2.264 | ||
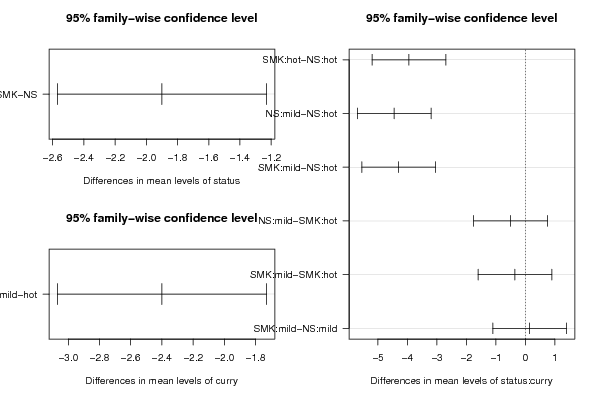
| Tukey Honest Significant Difference Comparisons | ||||
| diff | lwr | upr | p adj | |
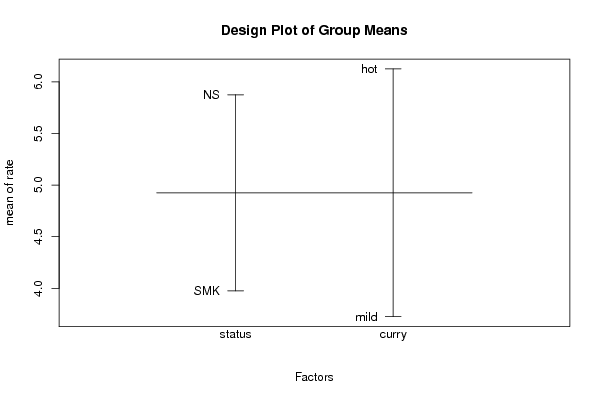
| SMK-NS | -1.9 | -2.57 | -1.23 | 0 |
| mild-hot | -2.4 | -3.07 | -1.73 | 0 |
| SMK:hot-NS:hot | -3.95 | -5.2 | -2.7 | 0 |
| NS:mild-NS:hot | -4.45 | -5.7 | -3.2 | 0 |
| SMK:mild-NS:hot | -4.3 | -5.55 | -3.05 | 0 |
| NS:mild-SMK:hot | -0.5 | -1.75 | 0.75 | 0.72 |
| SMK:mild-SMK:hot | -0.35 | -1.6 | 0.9 | 0.882 |
| SMK:mild-NS:mild | 0.15 | -1.1 | 1.4 | 0.989 |
| Levenes Test for Homogeneity of Variance | |||
| Df | F value | Pr(>F) | |
| Group | 3 | 0.25 | 0.861 |
| 76 | |||