Free Statistics

of Irreproducible Research!

Author's title

Author*Unverified author*
R Software Modulerwasp_autocorrelation.wasp
Title produced by software(Partial) Autocorrelation Function
Date of computationThu, 11 Dec 2008 15:22:27 -0700
Cite this page as followsStatistical Computations at FreeStatistics.org, Office for Research Development and Education, URL https://freestatistics.org/blog/index.php?v=date/2008/Dec/11/t1229034223hngdirf5p08a4yp.htm/, Retrieved Sat, 25 May 2024 08:59:14 +0000
Statistical Computations at FreeStatistics.org, Office for Research Development and Education, URL https://freestatistics.org/blog/index.php?pk=32457, Retrieved Sat, 25 May 2024 08:59:14 +0000
QR Codes:

Original text written by user:
IsPrivate?No (this computation is public)
User-defined keywords
Estimated Impact187
Family? (F = Feedback message, R = changed R code, M = changed R Module, P = changed Parameters, D = changed Data)
-     [Harrell-Davis Quantiles] [Harrel davis deci...] [2008-10-18 16:19:32] [ea79f99c5895b39ae8bb6e8c563d0f54]
-   PD  [Harrell-Davis Quantiles] [Harrel davis deci...] [2008-10-18 17:17:36] [ea79f99c5895b39ae8bb6e8c563d0f54]
- RMPD    [(Partial) Autocorrelation Function] [OEF 2 deel 1 De L...] [2008-12-11 08:24:21] [ea79f99c5895b39ae8bb6e8c563d0f54]
-   P         [(Partial) Autocorrelation Function] [oef 2 opg6 autocorr] [2008-12-11 22:22:27] [d41d8cd98f00b204e9800998ecf8427e] [Current]
Feedback Forum

Post a new message
Dataseries X:
102.9
102.9
102.9
102.9
104.2
104.7
104.7
104.7
104.7
104.7
104.7
104.7
104.7
104.7
104.7
104.7
106
107
107
107
107
107
107
107
107
107
107
107
107.6
109.9
109.9
109.9
109.9
109.9
109.9
109.9
109.9
109.9
109.9
109.9
110.6
114.3
114.3
114.3
114.3
114.3
114.3
114.3
114.3
114.3
114.3
114.3
114.3
119.01
119.01
119.01
119.01
119.01
119.01
119.01
119.01
119.01
119.01
119.01
121.27
123.54
123.54
123.54
123.54
123.54
123.54
123.54
123.54
123.54
123.54
123.54
123.54
125.24
125.24
125.24
125.24
125.24
125.24
125.24
125.24
125.24
125.24
125.24
125.24
128.35
128.35
128.35
128.35
128.35
128.35
128.35


Summary of computational transaction
Raw Inputview raw input (R code)
Raw Outputview raw output of R engine
Computing time2 seconds
R Server'Sir Ronald Aylmer Fisher' @ 193.190.124.24

\begin{tabular}{lllllllll}
\hline
Summary of computational transaction \tabularnewline
Raw Input & view raw input (R code)  \tabularnewline
Raw Output & view raw output of R engine  \tabularnewline
Computing time & 2 seconds \tabularnewline
R Server & 'Sir Ronald Aylmer Fisher' @ 193.190.124.24 \tabularnewline
\hline
\end{tabular}
%Source: https://freestatistics.org/blog/index.php?pk=32457&T=0

[TABLE]
[ROW][C]Summary of computational transaction[/C][/ROW]
[ROW][C]Raw Input[/C][C]view raw input (R code) [/C][/ROW]
[ROW][C]Raw Output[/C][C]view raw output of R engine [/C][/ROW]
[ROW][C]Computing time[/C][C]2 seconds[/C][/ROW]
[ROW][C]R Server[/C][C]'Sir Ronald Aylmer Fisher' @ 193.190.124.24[/C][/ROW]
[/TABLE]
Source: https://freestatistics.org/blog/index.php?pk=32457&T=0

Globally Unique Identifier (entire table): ba.freestatistics.org/blog/index.php?pk=32457&T=0

As an alternative you can also use a QR Code:  

The GUIDs for individual cells are displayed in the table below:

Summary of computational transaction
Raw Inputview raw input (R code)
Raw Outputview raw output of R engine
Computing time2 seconds
R Server'Sir Ronald Aylmer Fisher' @ 193.190.124.24


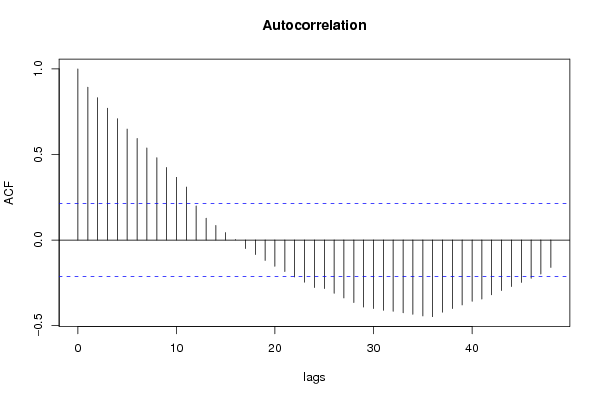
Autocorrelation Function
Time lag kACF(k)T-STATP-value
10.8930218.18470
20.8318677.62420
30.7707147.06370
40.709566.50320
50.6484065.94270
60.5932195.43690
70.5380324.93112e-06
80.4808614.40721.5e-05
90.423693.88320.000102
100.3665183.35920.000589
110.3093472.83520.002868
120.1991691.82540.035746
130.1277431.17080.122498
140.0856110.78460.217437
150.0434790.39850.34564
160.0013470.01230.49509
17-0.049138-0.45040.326806
18-0.08411-0.77090.221469
19-0.119083-1.09140.139107
20-0.153253-1.40460.081916
21-0.184243-1.68860.047501
22-0.215233-1.97260.025913
23-0.246223-2.25670.013312
24-0.277385-2.54230.006424
25-0.283469-2.5980.005535
26-0.310722-2.84780.002766
27-0.337975-3.09760.001326
28-0.365228-3.34740.000611
29-0.391288-3.58620.000281
30-0.400641-3.67190.000211
31-0.409995-3.75770.000158
32-0.415915-3.81190.000131
33-0.425015-3.89539.8e-05
34-0.434116-3.97877.3e-05
35-0.443216-4.06215.4e-05
36-0.447688-4.10314.7e-05
37-0.421234-3.86070.000111
38-0.400115-3.66710.000215
39-0.378997-3.47360.000407
40-0.357878-3.280.000756
41-0.345112-3.1630.001087
42-0.320294-2.93550.002147
43-0.295476-2.70810.004099
44-0.27208-2.49370.007302
45-0.247698-2.27020.012878
46-0.223316-2.04670.021906
47-0.198934-1.82330.03591
48-0.160025-1.46670.073102

\begin{tabular}{lllllllll}
\hline
Autocorrelation Function \tabularnewline
Time lag k & ACF(k) & T-STAT & P-value \tabularnewline
1 & 0.893021 & 8.1847 & 0 \tabularnewline
2 & 0.831867 & 7.6242 & 0 \tabularnewline
3 & 0.770714 & 7.0637 & 0 \tabularnewline
4 & 0.70956 & 6.5032 & 0 \tabularnewline
5 & 0.648406 & 5.9427 & 0 \tabularnewline
6 & 0.593219 & 5.4369 & 0 \tabularnewline
7 & 0.538032 & 4.9311 & 2e-06 \tabularnewline
8 & 0.480861 & 4.4072 & 1.5e-05 \tabularnewline
9 & 0.42369 & 3.8832 & 0.000102 \tabularnewline
10 & 0.366518 & 3.3592 & 0.000589 \tabularnewline
11 & 0.309347 & 2.8352 & 0.002868 \tabularnewline
12 & 0.199169 & 1.8254 & 0.035746 \tabularnewline
13 & 0.127743 & 1.1708 & 0.122498 \tabularnewline
14 & 0.085611 & 0.7846 & 0.217437 \tabularnewline
15 & 0.043479 & 0.3985 & 0.34564 \tabularnewline
16 & 0.001347 & 0.0123 & 0.49509 \tabularnewline
17 & -0.049138 & -0.4504 & 0.326806 \tabularnewline
18 & -0.08411 & -0.7709 & 0.221469 \tabularnewline
19 & -0.119083 & -1.0914 & 0.139107 \tabularnewline
20 & -0.153253 & -1.4046 & 0.081916 \tabularnewline
21 & -0.184243 & -1.6886 & 0.047501 \tabularnewline
22 & -0.215233 & -1.9726 & 0.025913 \tabularnewline
23 & -0.246223 & -2.2567 & 0.013312 \tabularnewline
24 & -0.277385 & -2.5423 & 0.006424 \tabularnewline
25 & -0.283469 & -2.598 & 0.005535 \tabularnewline
26 & -0.310722 & -2.8478 & 0.002766 \tabularnewline
27 & -0.337975 & -3.0976 & 0.001326 \tabularnewline
28 & -0.365228 & -3.3474 & 0.000611 \tabularnewline
29 & -0.391288 & -3.5862 & 0.000281 \tabularnewline
30 & -0.400641 & -3.6719 & 0.000211 \tabularnewline
31 & -0.409995 & -3.7577 & 0.000158 \tabularnewline
32 & -0.415915 & -3.8119 & 0.000131 \tabularnewline
33 & -0.425015 & -3.8953 & 9.8e-05 \tabularnewline
34 & -0.434116 & -3.9787 & 7.3e-05 \tabularnewline
35 & -0.443216 & -4.0621 & 5.4e-05 \tabularnewline
36 & -0.447688 & -4.1031 & 4.7e-05 \tabularnewline
37 & -0.421234 & -3.8607 & 0.000111 \tabularnewline
38 & -0.400115 & -3.6671 & 0.000215 \tabularnewline
39 & -0.378997 & -3.4736 & 0.000407 \tabularnewline
40 & -0.357878 & -3.28 & 0.000756 \tabularnewline
41 & -0.345112 & -3.163 & 0.001087 \tabularnewline
42 & -0.320294 & -2.9355 & 0.002147 \tabularnewline
43 & -0.295476 & -2.7081 & 0.004099 \tabularnewline
44 & -0.27208 & -2.4937 & 0.007302 \tabularnewline
45 & -0.247698 & -2.2702 & 0.012878 \tabularnewline
46 & -0.223316 & -2.0467 & 0.021906 \tabularnewline
47 & -0.198934 & -1.8233 & 0.03591 \tabularnewline
48 & -0.160025 & -1.4667 & 0.073102 \tabularnewline
\hline
\end{tabular}
%Source: https://freestatistics.org/blog/index.php?pk=32457&T=1

[TABLE]
[ROW][C]Autocorrelation Function[/C][/ROW]
[ROW][C]Time lag k[/C][C]ACF(k)[/C][C]T-STAT[/C][C]P-value[/C][/ROW]
[ROW][C]1[/C][C]0.893021[/C][C]8.1847[/C][C]0[/C][/ROW]
[ROW][C]2[/C][C]0.831867[/C][C]7.6242[/C][C]0[/C][/ROW]
[ROW][C]3[/C][C]0.770714[/C][C]7.0637[/C][C]0[/C][/ROW]
[ROW][C]4[/C][C]0.70956[/C][C]6.5032[/C][C]0[/C][/ROW]
[ROW][C]5[/C][C]0.648406[/C][C]5.9427[/C][C]0[/C][/ROW]
[ROW][C]6[/C][C]0.593219[/C][C]5.4369[/C][C]0[/C][/ROW]
[ROW][C]7[/C][C]0.538032[/C][C]4.9311[/C][C]2e-06[/C][/ROW]
[ROW][C]8[/C][C]0.480861[/C][C]4.4072[/C][C]1.5e-05[/C][/ROW]
[ROW][C]9[/C][C]0.42369[/C][C]3.8832[/C][C]0.000102[/C][/ROW]
[ROW][C]10[/C][C]0.366518[/C][C]3.3592[/C][C]0.000589[/C][/ROW]
[ROW][C]11[/C][C]0.309347[/C][C]2.8352[/C][C]0.002868[/C][/ROW]
[ROW][C]12[/C][C]0.199169[/C][C]1.8254[/C][C]0.035746[/C][/ROW]
[ROW][C]13[/C][C]0.127743[/C][C]1.1708[/C][C]0.122498[/C][/ROW]
[ROW][C]14[/C][C]0.085611[/C][C]0.7846[/C][C]0.217437[/C][/ROW]
[ROW][C]15[/C][C]0.043479[/C][C]0.3985[/C][C]0.34564[/C][/ROW]
[ROW][C]16[/C][C]0.001347[/C][C]0.0123[/C][C]0.49509[/C][/ROW]
[ROW][C]17[/C][C]-0.049138[/C][C]-0.4504[/C][C]0.326806[/C][/ROW]
[ROW][C]18[/C][C]-0.08411[/C][C]-0.7709[/C][C]0.221469[/C][/ROW]
[ROW][C]19[/C][C]-0.119083[/C][C]-1.0914[/C][C]0.139107[/C][/ROW]
[ROW][C]20[/C][C]-0.153253[/C][C]-1.4046[/C][C]0.081916[/C][/ROW]
[ROW][C]21[/C][C]-0.184243[/C][C]-1.6886[/C][C]0.047501[/C][/ROW]
[ROW][C]22[/C][C]-0.215233[/C][C]-1.9726[/C][C]0.025913[/C][/ROW]
[ROW][C]23[/C][C]-0.246223[/C][C]-2.2567[/C][C]0.013312[/C][/ROW]
[ROW][C]24[/C][C]-0.277385[/C][C]-2.5423[/C][C]0.006424[/C][/ROW]
[ROW][C]25[/C][C]-0.283469[/C][C]-2.598[/C][C]0.005535[/C][/ROW]
[ROW][C]26[/C][C]-0.310722[/C][C]-2.8478[/C][C]0.002766[/C][/ROW]
[ROW][C]27[/C][C]-0.337975[/C][C]-3.0976[/C][C]0.001326[/C][/ROW]
[ROW][C]28[/C][C]-0.365228[/C][C]-3.3474[/C][C]0.000611[/C][/ROW]
[ROW][C]29[/C][C]-0.391288[/C][C]-3.5862[/C][C]0.000281[/C][/ROW]
[ROW][C]30[/C][C]-0.400641[/C][C]-3.6719[/C][C]0.000211[/C][/ROW]
[ROW][C]31[/C][C]-0.409995[/C][C]-3.7577[/C][C]0.000158[/C][/ROW]
[ROW][C]32[/C][C]-0.415915[/C][C]-3.8119[/C][C]0.000131[/C][/ROW]
[ROW][C]33[/C][C]-0.425015[/C][C]-3.8953[/C][C]9.8e-05[/C][/ROW]
[ROW][C]34[/C][C]-0.434116[/C][C]-3.9787[/C][C]7.3e-05[/C][/ROW]
[ROW][C]35[/C][C]-0.443216[/C][C]-4.0621[/C][C]5.4e-05[/C][/ROW]
[ROW][C]36[/C][C]-0.447688[/C][C]-4.1031[/C][C]4.7e-05[/C][/ROW]
[ROW][C]37[/C][C]-0.421234[/C][C]-3.8607[/C][C]0.000111[/C][/ROW]
[ROW][C]38[/C][C]-0.400115[/C][C]-3.6671[/C][C]0.000215[/C][/ROW]
[ROW][C]39[/C][C]-0.378997[/C][C]-3.4736[/C][C]0.000407[/C][/ROW]
[ROW][C]40[/C][C]-0.357878[/C][C]-3.28[/C][C]0.000756[/C][/ROW]
[ROW][C]41[/C][C]-0.345112[/C][C]-3.163[/C][C]0.001087[/C][/ROW]
[ROW][C]42[/C][C]-0.320294[/C][C]-2.9355[/C][C]0.002147[/C][/ROW]
[ROW][C]43[/C][C]-0.295476[/C][C]-2.7081[/C][C]0.004099[/C][/ROW]
[ROW][C]44[/C][C]-0.27208[/C][C]-2.4937[/C][C]0.007302[/C][/ROW]
[ROW][C]45[/C][C]-0.247698[/C][C]-2.2702[/C][C]0.012878[/C][/ROW]
[ROW][C]46[/C][C]-0.223316[/C][C]-2.0467[/C][C]0.021906[/C][/ROW]
[ROW][C]47[/C][C]-0.198934[/C][C]-1.8233[/C][C]0.03591[/C][/ROW]
[ROW][C]48[/C][C]-0.160025[/C][C]-1.4667[/C][C]0.073102[/C][/ROW]
[/TABLE]
Source: https://freestatistics.org/blog/index.php?pk=32457&T=1

Globally Unique Identifier (entire table): ba.freestatistics.org/blog/index.php?pk=32457&T=1

As an alternative you can also use a QR Code:  

The GUIDs for individual cells are displayed in the table below:

Autocorrelation Function
Time lag kACF(k)T-STATP-value
10.8930218.18470
20.8318677.62420
30.7707147.06370
40.709566.50320
50.6484065.94270
60.5932195.43690
70.5380324.93112e-06
80.4808614.40721.5e-05
90.423693.88320.000102
100.3665183.35920.000589
110.3093472.83520.002868
120.1991691.82540.035746
130.1277431.17080.122498
140.0856110.78460.217437
150.0434790.39850.34564
160.0013470.01230.49509
17-0.049138-0.45040.326806
18-0.08411-0.77090.221469
19-0.119083-1.09140.139107
20-0.153253-1.40460.081916
21-0.184243-1.68860.047501
22-0.215233-1.97260.025913
23-0.246223-2.25670.013312
24-0.277385-2.54230.006424
25-0.283469-2.5980.005535
26-0.310722-2.84780.002766
27-0.337975-3.09760.001326
28-0.365228-3.34740.000611
29-0.391288-3.58620.000281
30-0.400641-3.67190.000211
31-0.409995-3.75770.000158
32-0.415915-3.81190.000131
33-0.425015-3.89539.8e-05
34-0.434116-3.97877.3e-05
35-0.443216-4.06215.4e-05
36-0.447688-4.10314.7e-05
37-0.421234-3.86070.000111
38-0.400115-3.66710.000215
39-0.378997-3.47360.000407
40-0.357878-3.280.000756
41-0.345112-3.1630.001087
42-0.320294-2.93550.002147
43-0.295476-2.70810.004099
44-0.27208-2.49370.007302
45-0.247698-2.27020.012878
46-0.223316-2.04670.021906
47-0.198934-1.82330.03591
48-0.160025-1.46670.073102


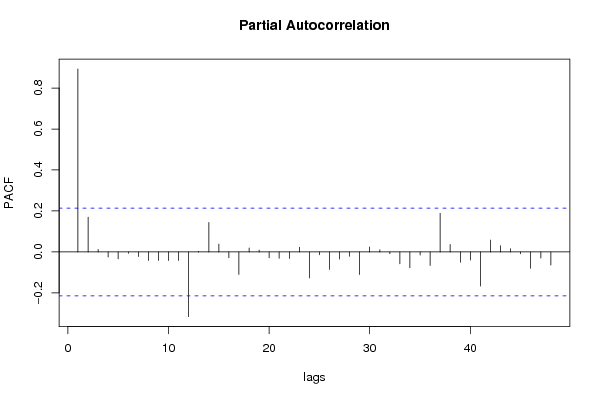
Partial Autocorrelation Function
Time lag kPACF(k)T-STATP-value
10.8930218.18470
20.1697711.5560.061737
30.011940.10940.45656
4-0.024508-0.22460.41141
5-0.033691-0.30880.379126
6-0.006423-0.05890.4766
7-0.022694-0.2080.417869
8-0.0423-0.38770.349615
9-0.0418-0.38310.351306
10-0.041414-0.37960.352612
11-0.041623-0.38150.351904
12-0.315737-2.89380.002424
130.0030610.02810.488843
140.1437141.31720.095683
150.0384280.35220.362784
16-0.028593-0.26210.396957
17-0.109542-1.0040.159139
180.0192580.17650.430163
190.0091940.08430.466523
20-0.028652-0.26260.396749
21-0.030597-0.28040.389919
22-0.031499-0.28870.386764
230.0231660.21230.416186
24-0.126755-1.16170.124318
25-0.014074-0.1290.448836
26-0.085084-0.77980.218849
27-0.034469-0.31590.376428
28-0.020817-0.19080.424576
29-0.110482-1.01260.157084
300.024750.22680.410551
310.0107270.09830.46096
32-0.008412-0.07710.469364
33-0.058104-0.53250.297882
34-0.077047-0.70620.241024
35-0.014796-0.13560.446227
36-0.065745-0.60260.274212
370.1882511.72530.044071
380.0362320.33210.370331
39-0.050302-0.4610.322986
40-0.039572-0.36270.358875
41-0.166433-1.52540.06546
420.0579210.53090.298461
430.0302990.27770.390964
440.0154560.14170.443846
45-0.008637-0.07920.468546
46-0.079987-0.73310.232771
47-0.029591-0.27120.39345
48-0.063658-0.58340.280581

\begin{tabular}{lllllllll}
\hline
Partial Autocorrelation Function \tabularnewline
Time lag k & PACF(k) & T-STAT & P-value \tabularnewline
1 & 0.893021 & 8.1847 & 0 \tabularnewline
2 & 0.169771 & 1.556 & 0.061737 \tabularnewline
3 & 0.01194 & 0.1094 & 0.45656 \tabularnewline
4 & -0.024508 & -0.2246 & 0.41141 \tabularnewline
5 & -0.033691 & -0.3088 & 0.379126 \tabularnewline
6 & -0.006423 & -0.0589 & 0.4766 \tabularnewline
7 & -0.022694 & -0.208 & 0.417869 \tabularnewline
8 & -0.0423 & -0.3877 & 0.349615 \tabularnewline
9 & -0.0418 & -0.3831 & 0.351306 \tabularnewline
10 & -0.041414 & -0.3796 & 0.352612 \tabularnewline
11 & -0.041623 & -0.3815 & 0.351904 \tabularnewline
12 & -0.315737 & -2.8938 & 0.002424 \tabularnewline
13 & 0.003061 & 0.0281 & 0.488843 \tabularnewline
14 & 0.143714 & 1.3172 & 0.095683 \tabularnewline
15 & 0.038428 & 0.3522 & 0.362784 \tabularnewline
16 & -0.028593 & -0.2621 & 0.396957 \tabularnewline
17 & -0.109542 & -1.004 & 0.159139 \tabularnewline
18 & 0.019258 & 0.1765 & 0.430163 \tabularnewline
19 & 0.009194 & 0.0843 & 0.466523 \tabularnewline
20 & -0.028652 & -0.2626 & 0.396749 \tabularnewline
21 & -0.030597 & -0.2804 & 0.389919 \tabularnewline
22 & -0.031499 & -0.2887 & 0.386764 \tabularnewline
23 & 0.023166 & 0.2123 & 0.416186 \tabularnewline
24 & -0.126755 & -1.1617 & 0.124318 \tabularnewline
25 & -0.014074 & -0.129 & 0.448836 \tabularnewline
26 & -0.085084 & -0.7798 & 0.218849 \tabularnewline
27 & -0.034469 & -0.3159 & 0.376428 \tabularnewline
28 & -0.020817 & -0.1908 & 0.424576 \tabularnewline
29 & -0.110482 & -1.0126 & 0.157084 \tabularnewline
30 & 0.02475 & 0.2268 & 0.410551 \tabularnewline
31 & 0.010727 & 0.0983 & 0.46096 \tabularnewline
32 & -0.008412 & -0.0771 & 0.469364 \tabularnewline
33 & -0.058104 & -0.5325 & 0.297882 \tabularnewline
34 & -0.077047 & -0.7062 & 0.241024 \tabularnewline
35 & -0.014796 & -0.1356 & 0.446227 \tabularnewline
36 & -0.065745 & -0.6026 & 0.274212 \tabularnewline
37 & 0.188251 & 1.7253 & 0.044071 \tabularnewline
38 & 0.036232 & 0.3321 & 0.370331 \tabularnewline
39 & -0.050302 & -0.461 & 0.322986 \tabularnewline
40 & -0.039572 & -0.3627 & 0.358875 \tabularnewline
41 & -0.166433 & -1.5254 & 0.06546 \tabularnewline
42 & 0.057921 & 0.5309 & 0.298461 \tabularnewline
43 & 0.030299 & 0.2777 & 0.390964 \tabularnewline
44 & 0.015456 & 0.1417 & 0.443846 \tabularnewline
45 & -0.008637 & -0.0792 & 0.468546 \tabularnewline
46 & -0.079987 & -0.7331 & 0.232771 \tabularnewline
47 & -0.029591 & -0.2712 & 0.39345 \tabularnewline
48 & -0.063658 & -0.5834 & 0.280581 \tabularnewline
\hline
\end{tabular}
%Source: https://freestatistics.org/blog/index.php?pk=32457&T=2

[TABLE]
[ROW][C]Partial Autocorrelation Function[/C][/ROW]
[ROW][C]Time lag k[/C][C]PACF(k)[/C][C]T-STAT[/C][C]P-value[/C][/ROW]
[ROW][C]1[/C][C]0.893021[/C][C]8.1847[/C][C]0[/C][/ROW]
[ROW][C]2[/C][C]0.169771[/C][C]1.556[/C][C]0.061737[/C][/ROW]
[ROW][C]3[/C][C]0.01194[/C][C]0.1094[/C][C]0.45656[/C][/ROW]
[ROW][C]4[/C][C]-0.024508[/C][C]-0.2246[/C][C]0.41141[/C][/ROW]
[ROW][C]5[/C][C]-0.033691[/C][C]-0.3088[/C][C]0.379126[/C][/ROW]
[ROW][C]6[/C][C]-0.006423[/C][C]-0.0589[/C][C]0.4766[/C][/ROW]
[ROW][C]7[/C][C]-0.022694[/C][C]-0.208[/C][C]0.417869[/C][/ROW]
[ROW][C]8[/C][C]-0.0423[/C][C]-0.3877[/C][C]0.349615[/C][/ROW]
[ROW][C]9[/C][C]-0.0418[/C][C]-0.3831[/C][C]0.351306[/C][/ROW]
[ROW][C]10[/C][C]-0.041414[/C][C]-0.3796[/C][C]0.352612[/C][/ROW]
[ROW][C]11[/C][C]-0.041623[/C][C]-0.3815[/C][C]0.351904[/C][/ROW]
[ROW][C]12[/C][C]-0.315737[/C][C]-2.8938[/C][C]0.002424[/C][/ROW]
[ROW][C]13[/C][C]0.003061[/C][C]0.0281[/C][C]0.488843[/C][/ROW]
[ROW][C]14[/C][C]0.143714[/C][C]1.3172[/C][C]0.095683[/C][/ROW]
[ROW][C]15[/C][C]0.038428[/C][C]0.3522[/C][C]0.362784[/C][/ROW]
[ROW][C]16[/C][C]-0.028593[/C][C]-0.2621[/C][C]0.396957[/C][/ROW]
[ROW][C]17[/C][C]-0.109542[/C][C]-1.004[/C][C]0.159139[/C][/ROW]
[ROW][C]18[/C][C]0.019258[/C][C]0.1765[/C][C]0.430163[/C][/ROW]
[ROW][C]19[/C][C]0.009194[/C][C]0.0843[/C][C]0.466523[/C][/ROW]
[ROW][C]20[/C][C]-0.028652[/C][C]-0.2626[/C][C]0.396749[/C][/ROW]
[ROW][C]21[/C][C]-0.030597[/C][C]-0.2804[/C][C]0.389919[/C][/ROW]
[ROW][C]22[/C][C]-0.031499[/C][C]-0.2887[/C][C]0.386764[/C][/ROW]
[ROW][C]23[/C][C]0.023166[/C][C]0.2123[/C][C]0.416186[/C][/ROW]
[ROW][C]24[/C][C]-0.126755[/C][C]-1.1617[/C][C]0.124318[/C][/ROW]
[ROW][C]25[/C][C]-0.014074[/C][C]-0.129[/C][C]0.448836[/C][/ROW]
[ROW][C]26[/C][C]-0.085084[/C][C]-0.7798[/C][C]0.218849[/C][/ROW]
[ROW][C]27[/C][C]-0.034469[/C][C]-0.3159[/C][C]0.376428[/C][/ROW]
[ROW][C]28[/C][C]-0.020817[/C][C]-0.1908[/C][C]0.424576[/C][/ROW]
[ROW][C]29[/C][C]-0.110482[/C][C]-1.0126[/C][C]0.157084[/C][/ROW]
[ROW][C]30[/C][C]0.02475[/C][C]0.2268[/C][C]0.410551[/C][/ROW]
[ROW][C]31[/C][C]0.010727[/C][C]0.0983[/C][C]0.46096[/C][/ROW]
[ROW][C]32[/C][C]-0.008412[/C][C]-0.0771[/C][C]0.469364[/C][/ROW]
[ROW][C]33[/C][C]-0.058104[/C][C]-0.5325[/C][C]0.297882[/C][/ROW]
[ROW][C]34[/C][C]-0.077047[/C][C]-0.7062[/C][C]0.241024[/C][/ROW]
[ROW][C]35[/C][C]-0.014796[/C][C]-0.1356[/C][C]0.446227[/C][/ROW]
[ROW][C]36[/C][C]-0.065745[/C][C]-0.6026[/C][C]0.274212[/C][/ROW]
[ROW][C]37[/C][C]0.188251[/C][C]1.7253[/C][C]0.044071[/C][/ROW]
[ROW][C]38[/C][C]0.036232[/C][C]0.3321[/C][C]0.370331[/C][/ROW]
[ROW][C]39[/C][C]-0.050302[/C][C]-0.461[/C][C]0.322986[/C][/ROW]
[ROW][C]40[/C][C]-0.039572[/C][C]-0.3627[/C][C]0.358875[/C][/ROW]
[ROW][C]41[/C][C]-0.166433[/C][C]-1.5254[/C][C]0.06546[/C][/ROW]
[ROW][C]42[/C][C]0.057921[/C][C]0.5309[/C][C]0.298461[/C][/ROW]
[ROW][C]43[/C][C]0.030299[/C][C]0.2777[/C][C]0.390964[/C][/ROW]
[ROW][C]44[/C][C]0.015456[/C][C]0.1417[/C][C]0.443846[/C][/ROW]
[ROW][C]45[/C][C]-0.008637[/C][C]-0.0792[/C][C]0.468546[/C][/ROW]
[ROW][C]46[/C][C]-0.079987[/C][C]-0.7331[/C][C]0.232771[/C][/ROW]
[ROW][C]47[/C][C]-0.029591[/C][C]-0.2712[/C][C]0.39345[/C][/ROW]
[ROW][C]48[/C][C]-0.063658[/C][C]-0.5834[/C][C]0.280581[/C][/ROW]
[/TABLE]
Source: https://freestatistics.org/blog/index.php?pk=32457&T=2

Globally Unique Identifier (entire table): ba.freestatistics.org/blog/index.php?pk=32457&T=2

As an alternative you can also use a QR Code:  

The GUIDs for individual cells are displayed in the table below:

Partial Autocorrelation Function
Time lag kPACF(k)T-STATP-value
10.8930218.18470
20.1697711.5560.061737
30.011940.10940.45656
4-0.024508-0.22460.41141
5-0.033691-0.30880.379126
6-0.006423-0.05890.4766
7-0.022694-0.2080.417869
8-0.0423-0.38770.349615
9-0.0418-0.38310.351306
10-0.041414-0.37960.352612
11-0.041623-0.38150.351904
12-0.315737-2.89380.002424
130.0030610.02810.488843
140.1437141.31720.095683
150.0384280.35220.362784
16-0.028593-0.26210.396957
17-0.109542-1.0040.159139
180.0192580.17650.430163
190.0091940.08430.466523
20-0.028652-0.26260.396749
21-0.030597-0.28040.389919
22-0.031499-0.28870.386764
230.0231660.21230.416186
24-0.126755-1.16170.124318
25-0.014074-0.1290.448836
26-0.085084-0.77980.218849
27-0.034469-0.31590.376428
28-0.020817-0.19080.424576
29-0.110482-1.01260.157084
300.024750.22680.410551
310.0107270.09830.46096
32-0.008412-0.07710.469364
33-0.058104-0.53250.297882
34-0.077047-0.70620.241024
35-0.014796-0.13560.446227
36-0.065745-0.60260.274212
370.1882511.72530.044071
380.0362320.33210.370331
39-0.050302-0.4610.322986
40-0.039572-0.36270.358875
41-0.166433-1.52540.06546
420.0579210.53090.298461
430.0302990.27770.390964
440.0154560.14170.443846
45-0.008637-0.07920.468546
46-0.079987-0.73310.232771
47-0.029591-0.27120.39345
48-0.063658-0.58340.280581


Parameters (Session):
par1 = 48 ; par2 = 1 ; par3 = 0 ; par4 = 1 ; par5 = 12 ;
Parameters (R input):
par1 = 48 ; par2 = 1 ; par3 = 0 ; par4 = 1 ; par5 = 12 ;
R code (references can be found in the software module):
if (par1 == 'Default') {
par1 = 10*log10(length(x))
} else {
par1 <- as.numeric(par1)
}
par2 <- as.numeric(par2)
par3 <- as.numeric(par3)
par4 <- as.numeric(par4)
par5 <- as.numeric(par5)
if (par2 == 0) {
x <- log(x)
} else {
x <- (x ^ par2 - 1) / par2
}
if (par3 > 0) x <- diff(x,lag=1,difference=par3)
if (par4 > 0) x <- diff(x,lag=par5,difference=par4)
bitmap(file='pic1.png')
racf <- acf(x,par1,main='Autocorrelation',xlab='lags',ylab='ACF')
dev.off()
bitmap(file='pic2.png')
rpacf <- pacf(x,par1,main='Partial Autocorrelation',xlab='lags',ylab='PACF')
dev.off()
(myacf <- c(racf$acf))
(mypacf <- c(rpacf$acf))
lengthx <- length(x)
sqrtn <- sqrt(lengthx)
load(file='createtable')
a<-table.start()
a<-table.row.start(a)
a<-table.element(a,'Autocorrelation Function',4,TRUE)
a<-table.row.end(a)
a<-table.row.start(a)
a<-table.element(a,'Time lag k',header=TRUE)
a<-table.element(a,hyperlink('basics.htm','ACF(k)','click here for more information about the Autocorrelation Function'),header=TRUE)
a<-table.element(a,'T-STAT',header=TRUE)
a<-table.element(a,'P-value',header=TRUE)
a<-table.row.end(a)
for (i in 2:(par1+1)) {
a<-table.row.start(a)
a<-table.element(a,i-1,header=TRUE)
a<-table.element(a,round(myacf[i],6))
mytstat <- myacf[i]*sqrtn
a<-table.element(a,round(mytstat,4))
a<-table.element(a,round(1-pt(abs(mytstat),lengthx),6))
a<-table.row.end(a)
}
a<-table.end(a)
table.save(a,file='mytable.tab')
a<-table.start()
a<-table.row.start(a)
a<-table.element(a,'Partial Autocorrelation Function',4,TRUE)
a<-table.row.end(a)
a<-table.row.start(a)
a<-table.element(a,'Time lag k',header=TRUE)
a<-table.element(a,hyperlink('basics.htm','PACF(k)','click here for more information about the Partial Autocorrelation Function'),header=TRUE)
a<-table.element(a,'T-STAT',header=TRUE)
a<-table.element(a,'P-value',header=TRUE)
a<-table.row.end(a)
for (i in 1:par1) {
a<-table.row.start(a)
a<-table.element(a,i,header=TRUE)
a<-table.element(a,round(mypacf[i],6))
mytstat <- mypacf[i]*sqrtn
a<-table.element(a,round(mytstat,4))
a<-table.element(a,round(1-pt(abs(mytstat),lengthx),6))
a<-table.row.end(a)
}
a<-table.end(a)
table.save(a,file='mytable1.tab')