Free Statistics

of Irreproducible Research!

Author's title

Author*The author of this computation has been verified*
R Software Modulerwasp_centraltendency.wasp
Title produced by softwareCentral Tendency
Date of computationSat, 02 Oct 2010 17:38:34 +0000
Cite this page as followsStatistical Computations at FreeStatistics.org, Office for Research Development and Education, URL https://freestatistics.org/blog/index.php?v=date/2010/Oct/02/t1286041288wvervjkb0abxtkp.htm/, Retrieved Wed, 24 Apr 2024 02:19:55 +0000
Statistical Computations at FreeStatistics.org, Office for Research Development and Education, URL https://freestatistics.org/blog/index.php?pk=80084, Retrieved Wed, 24 Apr 2024 02:19:55 +0000
QR Codes:

Original text written by user:
IsPrivate?No (this computation is public)
User-defined keywords
Estimated Impact230
Family? (F = Feedback message, R = changed R code, M = changed R Module, P = changed Parameters, D = changed Data)
F     [Univariate Data Series] [HPC Retail Sales] [2008-03-02 15:42:48] [74be16979710d4c4e7c6647856088456]
F RMPD    [Central Tendency] [Time Series Plot ...] [2010-10-02 17:38:34] [99c051a77087383325372ff23bc64341] [Current]
F RM        [Mean versus Median] [Mean versus Median] [2010-10-02 17:47:59] [d946de7cca328fbcf207448a112523ab]
Feedback Forum
2010-10-09 11:40:44 [Kim Van Assche] [reply
De mediaan is volgens mij geen goed gegeven om een voorspelling te maken voor de toekomst
2010-10-10 09:24:57 [Andries Achten] [reply
Hier moet vooral opgelet worden met uitschieters die een vertekend beeld kunnen geven en waardoor de toekomstvoorspelling niet correct zal zijn.
2010-10-10 11:43:23 [Ken Soltvedt] [reply
Ik denk dat de mediaan geen goed gegevens is op zich om voorspellingen op te gaan doen. Je weet dan nooit welke gegevens links en rechts van deze mediaan liggen (er van uitgaand dat je je alleen baseert op de Mediaan)

Post a new message
Dataseries X:
13328
12873
14000
13477
14237
13674
13529
14058
12975
14326
14008
16193
14483
14011
15057
14884
15414
14440
14900
15074
14442
15307
14938
17193
15528
14765
15838
15723
16150
15486
15986
15983
15692
16490
15686
18897
16316
15636
17163
16534
16518
16375
16290
16352
15943
16362
16393
19051
16747
16320
17910
16961
17480
17049
16879
17473
16998
17307
17418
20169
17871
17226
19062
17804
19100
18522
18060
18869
18127
18871
18890
21263
19547
18450
20254
19240
20216
19420
19415
20018
18652
19978
19509
21971


Summary of computational transaction
Raw Inputview raw input (R code)
Raw Outputview raw output of R engine
Computing time1 seconds
R Server'Gwilym Jenkins' @ 72.249.127.135

\begin{tabular}{lllllllll}
\hline
Summary of computational transaction \tabularnewline
Raw Input & view raw input (R code)  \tabularnewline
Raw Output & view raw output of R engine  \tabularnewline
Computing time & 1 seconds \tabularnewline
R Server & 'Gwilym Jenkins' @ 72.249.127.135 \tabularnewline
\hline
\end{tabular}
%Source: https://freestatistics.org/blog/index.php?pk=80084&T=0

[TABLE]
[ROW][C]Summary of computational transaction[/C][/ROW]
[ROW][C]Raw Input[/C][C]view raw input (R code) [/C][/ROW]
[ROW][C]Raw Output[/C][C]view raw output of R engine [/C][/ROW]
[ROW][C]Computing time[/C][C]1 seconds[/C][/ROW]
[ROW][C]R Server[/C][C]'Gwilym Jenkins' @ 72.249.127.135[/C][/ROW]
[/TABLE]
Source: https://freestatistics.org/blog/index.php?pk=80084&T=0

Globally Unique Identifier (entire table): ba.freestatistics.org/blog/index.php?pk=80084&T=0

As an alternative you can also use a QR Code:  

The GUIDs for individual cells are displayed in the table below:

Summary of computational transaction
Raw Inputview raw input (R code)
Raw Outputview raw output of R engine
Computing time1 seconds
R Server'Gwilym Jenkins' @ 72.249.127.135


Central Tendency - Ungrouped Data
MeasureValueS.E.Value/S.E.
Arithmetic Mean16750.2857142857227.18059075978773.7311477986115
Geometric Mean16623.1754136431
Harmonic Mean16497.0390487161
Quadratic Mean16877.6712326700
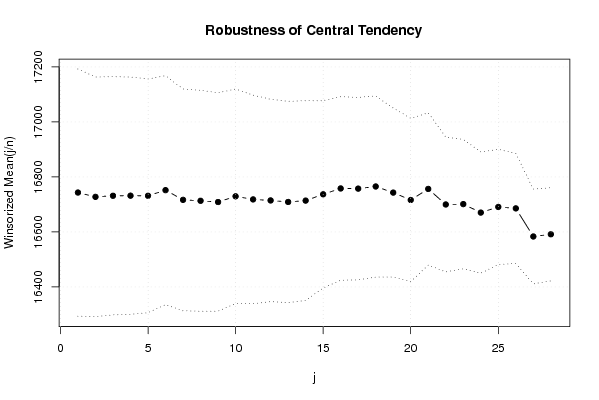
Winsorized Mean ( 1 / 28 )16743.0714285714224.74433602765274.4983020462478
Winsorized Mean ( 2 / 28 )16727.4523809524217.84218432260276.7870209939723
Winsorized Mean ( 3 / 28 )16731.4166666667216.59633873947577.2469967130491
Winsorized Mean ( 4 / 28 )16731.6547619048215.71899850265477.5622679413605
Winsorized Mean ( 5 / 28 )16731.2976190476212.49842615580178.7361013524893
Winsorized Mean ( 6 / 28 )16751.7261904762208.09049991175980.5021190183108
Winsorized Mean ( 7 / 28 )16716.4761904762201.58580177672882.9248689299606
Winsorized Mean ( 8 / 28 )16713.1428571429200.93004575785883.1789133083856
Winsorized Mean ( 9 / 28 )16708.6428571429198.53314467892784.160470455271
Winsorized Mean ( 10 / 28 )16729.3571428571195.0802000829185.7563050260718
Winsorized Mean ( 11 / 28 )16718.0952380952189.55893155162888.1947112765928
Winsorized Mean ( 12 / 28 )16714.3809523810183.94136945413290.8679814768308
Winsorized Mean ( 13 / 28 )16708.8095238095182.98012118625891.3148893742476
Winsorized Mean ( 14 / 28 )16713.8095238095181.68058798806791.9955715076577
Winsorized Mean ( 15 / 28 )16736.6666666667170.19987518757298.33536392563
Winsorized Mean ( 16 / 28 )16758166.879663667344100.419665474669
Winsorized Mean ( 17 / 28 )16757.3928571429165.851009576273101.038835397841
Winsorized Mean ( 18 / 28 )16765.1071428571164.691548315605101.797009708898
Winsorized Mean ( 19 / 28 )16742.9404761905153.658430232897108.962068991682
Winsorized Mean ( 20 / 28 )16716.0357142857148.536903939802112.537930109680
Winsorized Mean ( 21 / 28 )16756.2857142857138.328354538653121.134136021285
Winsorized Mean ( 22 / 28 )16699.7142857143122.598179855146136.215026238118
Winsorized Mean ( 23 / 28 )16701.0833333333117.560599732180142.063611204611
Winsorized Mean ( 24 / 28 )16670.2261904762110.171874995066151.311087255461
Winsorized Mean ( 25 / 28 )16690.7619047619104.635569001931159.513271289745
Winsorized Mean ( 26 / 28 )16685.599.9560380992349166.928384890915
Winsorized Mean ( 27 / 28 )16583.285714285786.131987822671192.533414512939
Winsorized Mean ( 28 / 28 )16591.285714285784.5556635168089196.217320333457
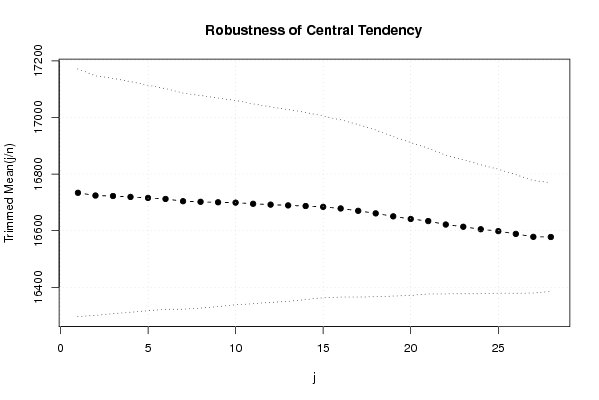
Trimmed Mean ( 1 / 28 )16733.9024390244218.64355076563576.5350836117801
Trimmed Mean ( 2 / 28 )16724.275211.56115686333979.0517278689456
Trimmed Mean ( 3 / 28 )16722.5641025641207.61296055045880.5468216349618
Trimmed Mean ( 4 / 28 )16719.3026315789203.53838296561882.1432419181752
Trimmed Mean ( 5 / 28 )16715.7972972973199.06274555476483.9725045020974
Trimmed Mean ( 6 / 28 )16712.1805555556194.75794065585485.8100085638447
Trimmed Mean ( 7 / 28 )16704.2714285714190.82236319306987.5383322429066
Trimmed Mean ( 8 / 28 )16702.1176470588187.70618225235988.9801148083865
Trimmed Mean ( 9 / 28 )16700.3636363636184.10207039749790.7125248526845
Trimmed Mean ( 10 / 28 )16699.15625180.26712462237392.6356166438098
Trimmed Mean ( 11 / 28 )16695.0645161290176.32610477538694.6828862203704
Trimmed Mean ( 12 / 28 )16692.1333333333172.63010890612896.6930591604394
Trimmed Mean ( 13 / 28 )16689.4482758621169.18163789720698.6481067525929
Trimmed Mean ( 14 / 28 )16687.2142857143165.090920865242101.078933948981
Trimmed Mean ( 15 / 28 )16684.2592592593160.252816476993104.112112511012
Trimmed Mean ( 16 / 28 )16678.6153846154156.456674243764106.602134202531
Trimmed Mean ( 17 / 28 )16670.28152.266077640425109.481246633060
Trimmed Mean ( 18 / 28 )16661.3125147.109002610846113.258279264356
Trimmed Mean ( 19 / 28 )16650.7826086957140.690907015877118.350097826980
Trimmed Mean ( 20 / 28 )16641.5227272727134.888276879695123.37263928514
Trimmed Mean ( 21 / 28 )16634.0714285714128.488480631091129.459632076514
Trimmed Mean ( 22 / 28 )16621.85122.381044021929135.820462497620
Trimmed Mean ( 23 / 28 )16614.0263157895118.182065866699140.579928045334
Trimmed Mean ( 24 / 28 )16605.1944444444113.639333534223146.121892200677
Trimmed Mean ( 25 / 28 )16598.5109.312885978727151.843946405643
Trimmed Mean ( 26 / 28 )16588.8125104.623253034901158.557605683186
Trimmed Mean ( 27 / 28 )16578.499.2121446959615167.100510232946
Trimmed Mean ( 28 / 28 )16577.857142857195.9831984068943172.716240112982
Median16441.5
Midrange17422
Midmean - Weighted Average at Xnp16597.7906976744
Midmean - Weighted Average at X(n+1)p16634.0714285714
Midmean - Empirical Distribution Function16597.7906976744
Midmean - Empirical Distribution Function - Averaging16634.0714285714
Midmean - Empirical Distribution Function - Interpolation16634.0714285714
Midmean - Closest Observation16597.7906976744
Midmean - True Basic - Statistics Graphics Toolkit16634.0714285714
Midmean - MS Excel (old versions)16641.5227272727
Number of observations84

\begin{tabular}{lllllllll}
\hline
Central Tendency - Ungrouped Data \tabularnewline
Measure & Value & S.E. & Value/S.E. \tabularnewline
Arithmetic Mean & 16750.2857142857 & 227.180590759787 & 73.7311477986115 \tabularnewline
Geometric Mean & 16623.1754136431 &  &  \tabularnewline
Harmonic Mean & 16497.0390487161 &  &  \tabularnewline
Quadratic Mean & 16877.6712326700 &  &  \tabularnewline
Winsorized Mean ( 1 / 28 ) & 16743.0714285714 & 224.744336027652 & 74.4983020462478 \tabularnewline
Winsorized Mean ( 2 / 28 ) & 16727.4523809524 & 217.842184322602 & 76.7870209939723 \tabularnewline
Winsorized Mean ( 3 / 28 ) & 16731.4166666667 & 216.596338739475 & 77.2469967130491 \tabularnewline
Winsorized Mean ( 4 / 28 ) & 16731.6547619048 & 215.718998502654 & 77.5622679413605 \tabularnewline
Winsorized Mean ( 5 / 28 ) & 16731.2976190476 & 212.498426155801 & 78.7361013524893 \tabularnewline
Winsorized Mean ( 6 / 28 ) & 16751.7261904762 & 208.090499911759 & 80.5021190183108 \tabularnewline
Winsorized Mean ( 7 / 28 ) & 16716.4761904762 & 201.585801776728 & 82.9248689299606 \tabularnewline
Winsorized Mean ( 8 / 28 ) & 16713.1428571429 & 200.930045757858 & 83.1789133083856 \tabularnewline
Winsorized Mean ( 9 / 28 ) & 16708.6428571429 & 198.533144678927 & 84.160470455271 \tabularnewline
Winsorized Mean ( 10 / 28 ) & 16729.3571428571 & 195.08020008291 & 85.7563050260718 \tabularnewline
Winsorized Mean ( 11 / 28 ) & 16718.0952380952 & 189.558931551628 & 88.1947112765928 \tabularnewline
Winsorized Mean ( 12 / 28 ) & 16714.3809523810 & 183.941369454132 & 90.8679814768308 \tabularnewline
Winsorized Mean ( 13 / 28 ) & 16708.8095238095 & 182.980121186258 & 91.3148893742476 \tabularnewline
Winsorized Mean ( 14 / 28 ) & 16713.8095238095 & 181.680587988067 & 91.9955715076577 \tabularnewline
Winsorized Mean ( 15 / 28 ) & 16736.6666666667 & 170.199875187572 & 98.33536392563 \tabularnewline
Winsorized Mean ( 16 / 28 ) & 16758 & 166.879663667344 & 100.419665474669 \tabularnewline
Winsorized Mean ( 17 / 28 ) & 16757.3928571429 & 165.851009576273 & 101.038835397841 \tabularnewline
Winsorized Mean ( 18 / 28 ) & 16765.1071428571 & 164.691548315605 & 101.797009708898 \tabularnewline
Winsorized Mean ( 19 / 28 ) & 16742.9404761905 & 153.658430232897 & 108.962068991682 \tabularnewline
Winsorized Mean ( 20 / 28 ) & 16716.0357142857 & 148.536903939802 & 112.537930109680 \tabularnewline
Winsorized Mean ( 21 / 28 ) & 16756.2857142857 & 138.328354538653 & 121.134136021285 \tabularnewline
Winsorized Mean ( 22 / 28 ) & 16699.7142857143 & 122.598179855146 & 136.215026238118 \tabularnewline
Winsorized Mean ( 23 / 28 ) & 16701.0833333333 & 117.560599732180 & 142.063611204611 \tabularnewline
Winsorized Mean ( 24 / 28 ) & 16670.2261904762 & 110.171874995066 & 151.311087255461 \tabularnewline
Winsorized Mean ( 25 / 28 ) & 16690.7619047619 & 104.635569001931 & 159.513271289745 \tabularnewline
Winsorized Mean ( 26 / 28 ) & 16685.5 & 99.9560380992349 & 166.928384890915 \tabularnewline
Winsorized Mean ( 27 / 28 ) & 16583.2857142857 & 86.131987822671 & 192.533414512939 \tabularnewline
Winsorized Mean ( 28 / 28 ) & 16591.2857142857 & 84.5556635168089 & 196.217320333457 \tabularnewline
Trimmed Mean ( 1 / 28 ) & 16733.9024390244 & 218.643550765635 & 76.5350836117801 \tabularnewline
Trimmed Mean ( 2 / 28 ) & 16724.275 & 211.561156863339 & 79.0517278689456 \tabularnewline
Trimmed Mean ( 3 / 28 ) & 16722.5641025641 & 207.612960550458 & 80.5468216349618 \tabularnewline
Trimmed Mean ( 4 / 28 ) & 16719.3026315789 & 203.538382965618 & 82.1432419181752 \tabularnewline
Trimmed Mean ( 5 / 28 ) & 16715.7972972973 & 199.062745554764 & 83.9725045020974 \tabularnewline
Trimmed Mean ( 6 / 28 ) & 16712.1805555556 & 194.757940655854 & 85.8100085638447 \tabularnewline
Trimmed Mean ( 7 / 28 ) & 16704.2714285714 & 190.822363193069 & 87.5383322429066 \tabularnewline
Trimmed Mean ( 8 / 28 ) & 16702.1176470588 & 187.706182252359 & 88.9801148083865 \tabularnewline
Trimmed Mean ( 9 / 28 ) & 16700.3636363636 & 184.102070397497 & 90.7125248526845 \tabularnewline
Trimmed Mean ( 10 / 28 ) & 16699.15625 & 180.267124622373 & 92.6356166438098 \tabularnewline
Trimmed Mean ( 11 / 28 ) & 16695.0645161290 & 176.326104775386 & 94.6828862203704 \tabularnewline
Trimmed Mean ( 12 / 28 ) & 16692.1333333333 & 172.630108906128 & 96.6930591604394 \tabularnewline
Trimmed Mean ( 13 / 28 ) & 16689.4482758621 & 169.181637897206 & 98.6481067525929 \tabularnewline
Trimmed Mean ( 14 / 28 ) & 16687.2142857143 & 165.090920865242 & 101.078933948981 \tabularnewline
Trimmed Mean ( 15 / 28 ) & 16684.2592592593 & 160.252816476993 & 104.112112511012 \tabularnewline
Trimmed Mean ( 16 / 28 ) & 16678.6153846154 & 156.456674243764 & 106.602134202531 \tabularnewline
Trimmed Mean ( 17 / 28 ) & 16670.28 & 152.266077640425 & 109.481246633060 \tabularnewline
Trimmed Mean ( 18 / 28 ) & 16661.3125 & 147.109002610846 & 113.258279264356 \tabularnewline
Trimmed Mean ( 19 / 28 ) & 16650.7826086957 & 140.690907015877 & 118.350097826980 \tabularnewline
Trimmed Mean ( 20 / 28 ) & 16641.5227272727 & 134.888276879695 & 123.37263928514 \tabularnewline
Trimmed Mean ( 21 / 28 ) & 16634.0714285714 & 128.488480631091 & 129.459632076514 \tabularnewline
Trimmed Mean ( 22 / 28 ) & 16621.85 & 122.381044021929 & 135.820462497620 \tabularnewline
Trimmed Mean ( 23 / 28 ) & 16614.0263157895 & 118.182065866699 & 140.579928045334 \tabularnewline
Trimmed Mean ( 24 / 28 ) & 16605.1944444444 & 113.639333534223 & 146.121892200677 \tabularnewline
Trimmed Mean ( 25 / 28 ) & 16598.5 & 109.312885978727 & 151.843946405643 \tabularnewline
Trimmed Mean ( 26 / 28 ) & 16588.8125 & 104.623253034901 & 158.557605683186 \tabularnewline
Trimmed Mean ( 27 / 28 ) & 16578.4 & 99.2121446959615 & 167.100510232946 \tabularnewline
Trimmed Mean ( 28 / 28 ) & 16577.8571428571 & 95.9831984068943 & 172.716240112982 \tabularnewline
Median & 16441.5 &  &  \tabularnewline
Midrange & 17422 &  &  \tabularnewline
Midmean - Weighted Average at Xnp & 16597.7906976744 &  &  \tabularnewline
Midmean - Weighted Average at X(n+1)p & 16634.0714285714 &  &  \tabularnewline
Midmean - Empirical Distribution Function & 16597.7906976744 &  &  \tabularnewline
Midmean - Empirical Distribution Function - Averaging & 16634.0714285714 &  &  \tabularnewline
Midmean - Empirical Distribution Function - Interpolation & 16634.0714285714 &  &  \tabularnewline
Midmean - Closest Observation & 16597.7906976744 &  &  \tabularnewline
Midmean - True Basic - Statistics Graphics Toolkit & 16634.0714285714 &  &  \tabularnewline
Midmean - MS Excel (old versions) & 16641.5227272727 &  &  \tabularnewline
Number of observations & 84 &  &  \tabularnewline
\hline
\end{tabular}
%Source: https://freestatistics.org/blog/index.php?pk=80084&T=1

[TABLE]
[ROW][C]Central Tendency - Ungrouped Data[/C][/ROW]
[ROW][C]Measure[/C][C]Value[/C][C]S.E.[/C][C]Value/S.E.[/C][/ROW]
[ROW][C]Arithmetic Mean[/C][C]16750.2857142857[/C][C]227.180590759787[/C][C]73.7311477986115[/C][/ROW]
[ROW][C]Geometric Mean[/C][C]16623.1754136431[/C][C][/C][C][/C][/ROW]
[ROW][C]Harmonic Mean[/C][C]16497.0390487161[/C][C][/C][C][/C][/ROW]
[ROW][C]Quadratic Mean[/C][C]16877.6712326700[/C][C][/C][C][/C][/ROW]
[ROW][C]Winsorized Mean ( 1 / 28 )[/C][C]16743.0714285714[/C][C]224.744336027652[/C][C]74.4983020462478[/C][/ROW]
[ROW][C]Winsorized Mean ( 2 / 28 )[/C][C]16727.4523809524[/C][C]217.842184322602[/C][C]76.7870209939723[/C][/ROW]
[ROW][C]Winsorized Mean ( 3 / 28 )[/C][C]16731.4166666667[/C][C]216.596338739475[/C][C]77.2469967130491[/C][/ROW]
[ROW][C]Winsorized Mean ( 4 / 28 )[/C][C]16731.6547619048[/C][C]215.718998502654[/C][C]77.5622679413605[/C][/ROW]
[ROW][C]Winsorized Mean ( 5 / 28 )[/C][C]16731.2976190476[/C][C]212.498426155801[/C][C]78.7361013524893[/C][/ROW]
[ROW][C]Winsorized Mean ( 6 / 28 )[/C][C]16751.7261904762[/C][C]208.090499911759[/C][C]80.5021190183108[/C][/ROW]
[ROW][C]Winsorized Mean ( 7 / 28 )[/C][C]16716.4761904762[/C][C]201.585801776728[/C][C]82.9248689299606[/C][/ROW]
[ROW][C]Winsorized Mean ( 8 / 28 )[/C][C]16713.1428571429[/C][C]200.930045757858[/C][C]83.1789133083856[/C][/ROW]
[ROW][C]Winsorized Mean ( 9 / 28 )[/C][C]16708.6428571429[/C][C]198.533144678927[/C][C]84.160470455271[/C][/ROW]
[ROW][C]Winsorized Mean ( 10 / 28 )[/C][C]16729.3571428571[/C][C]195.08020008291[/C][C]85.7563050260718[/C][/ROW]
[ROW][C]Winsorized Mean ( 11 / 28 )[/C][C]16718.0952380952[/C][C]189.558931551628[/C][C]88.1947112765928[/C][/ROW]
[ROW][C]Winsorized Mean ( 12 / 28 )[/C][C]16714.3809523810[/C][C]183.941369454132[/C][C]90.8679814768308[/C][/ROW]
[ROW][C]Winsorized Mean ( 13 / 28 )[/C][C]16708.8095238095[/C][C]182.980121186258[/C][C]91.3148893742476[/C][/ROW]
[ROW][C]Winsorized Mean ( 14 / 28 )[/C][C]16713.8095238095[/C][C]181.680587988067[/C][C]91.9955715076577[/C][/ROW]
[ROW][C]Winsorized Mean ( 15 / 28 )[/C][C]16736.6666666667[/C][C]170.199875187572[/C][C]98.33536392563[/C][/ROW]
[ROW][C]Winsorized Mean ( 16 / 28 )[/C][C]16758[/C][C]166.879663667344[/C][C]100.419665474669[/C][/ROW]
[ROW][C]Winsorized Mean ( 17 / 28 )[/C][C]16757.3928571429[/C][C]165.851009576273[/C][C]101.038835397841[/C][/ROW]
[ROW][C]Winsorized Mean ( 18 / 28 )[/C][C]16765.1071428571[/C][C]164.691548315605[/C][C]101.797009708898[/C][/ROW]
[ROW][C]Winsorized Mean ( 19 / 28 )[/C][C]16742.9404761905[/C][C]153.658430232897[/C][C]108.962068991682[/C][/ROW]
[ROW][C]Winsorized Mean ( 20 / 28 )[/C][C]16716.0357142857[/C][C]148.536903939802[/C][C]112.537930109680[/C][/ROW]
[ROW][C]Winsorized Mean ( 21 / 28 )[/C][C]16756.2857142857[/C][C]138.328354538653[/C][C]121.134136021285[/C][/ROW]
[ROW][C]Winsorized Mean ( 22 / 28 )[/C][C]16699.7142857143[/C][C]122.598179855146[/C][C]136.215026238118[/C][/ROW]
[ROW][C]Winsorized Mean ( 23 / 28 )[/C][C]16701.0833333333[/C][C]117.560599732180[/C][C]142.063611204611[/C][/ROW]
[ROW][C]Winsorized Mean ( 24 / 28 )[/C][C]16670.2261904762[/C][C]110.171874995066[/C][C]151.311087255461[/C][/ROW]
[ROW][C]Winsorized Mean ( 25 / 28 )[/C][C]16690.7619047619[/C][C]104.635569001931[/C][C]159.513271289745[/C][/ROW]
[ROW][C]Winsorized Mean ( 26 / 28 )[/C][C]16685.5[/C][C]99.9560380992349[/C][C]166.928384890915[/C][/ROW]
[ROW][C]Winsorized Mean ( 27 / 28 )[/C][C]16583.2857142857[/C][C]86.131987822671[/C][C]192.533414512939[/C][/ROW]
[ROW][C]Winsorized Mean ( 28 / 28 )[/C][C]16591.2857142857[/C][C]84.5556635168089[/C][C]196.217320333457[/C][/ROW]
[ROW][C]Trimmed Mean ( 1 / 28 )[/C][C]16733.9024390244[/C][C]218.643550765635[/C][C]76.5350836117801[/C][/ROW]
[ROW][C]Trimmed Mean ( 2 / 28 )[/C][C]16724.275[/C][C]211.561156863339[/C][C]79.0517278689456[/C][/ROW]
[ROW][C]Trimmed Mean ( 3 / 28 )[/C][C]16722.5641025641[/C][C]207.612960550458[/C][C]80.5468216349618[/C][/ROW]
[ROW][C]Trimmed Mean ( 4 / 28 )[/C][C]16719.3026315789[/C][C]203.538382965618[/C][C]82.1432419181752[/C][/ROW]
[ROW][C]Trimmed Mean ( 5 / 28 )[/C][C]16715.7972972973[/C][C]199.062745554764[/C][C]83.9725045020974[/C][/ROW]
[ROW][C]Trimmed Mean ( 6 / 28 )[/C][C]16712.1805555556[/C][C]194.757940655854[/C][C]85.8100085638447[/C][/ROW]
[ROW][C]Trimmed Mean ( 7 / 28 )[/C][C]16704.2714285714[/C][C]190.822363193069[/C][C]87.5383322429066[/C][/ROW]
[ROW][C]Trimmed Mean ( 8 / 28 )[/C][C]16702.1176470588[/C][C]187.706182252359[/C][C]88.9801148083865[/C][/ROW]
[ROW][C]Trimmed Mean ( 9 / 28 )[/C][C]16700.3636363636[/C][C]184.102070397497[/C][C]90.7125248526845[/C][/ROW]
[ROW][C]Trimmed Mean ( 10 / 28 )[/C][C]16699.15625[/C][C]180.267124622373[/C][C]92.6356166438098[/C][/ROW]
[ROW][C]Trimmed Mean ( 11 / 28 )[/C][C]16695.0645161290[/C][C]176.326104775386[/C][C]94.6828862203704[/C][/ROW]
[ROW][C]Trimmed Mean ( 12 / 28 )[/C][C]16692.1333333333[/C][C]172.630108906128[/C][C]96.6930591604394[/C][/ROW]
[ROW][C]Trimmed Mean ( 13 / 28 )[/C][C]16689.4482758621[/C][C]169.181637897206[/C][C]98.6481067525929[/C][/ROW]
[ROW][C]Trimmed Mean ( 14 / 28 )[/C][C]16687.2142857143[/C][C]165.090920865242[/C][C]101.078933948981[/C][/ROW]
[ROW][C]Trimmed Mean ( 15 / 28 )[/C][C]16684.2592592593[/C][C]160.252816476993[/C][C]104.112112511012[/C][/ROW]
[ROW][C]Trimmed Mean ( 16 / 28 )[/C][C]16678.6153846154[/C][C]156.456674243764[/C][C]106.602134202531[/C][/ROW]
[ROW][C]Trimmed Mean ( 17 / 28 )[/C][C]16670.28[/C][C]152.266077640425[/C][C]109.481246633060[/C][/ROW]
[ROW][C]Trimmed Mean ( 18 / 28 )[/C][C]16661.3125[/C][C]147.109002610846[/C][C]113.258279264356[/C][/ROW]
[ROW][C]Trimmed Mean ( 19 / 28 )[/C][C]16650.7826086957[/C][C]140.690907015877[/C][C]118.350097826980[/C][/ROW]
[ROW][C]Trimmed Mean ( 20 / 28 )[/C][C]16641.5227272727[/C][C]134.888276879695[/C][C]123.37263928514[/C][/ROW]
[ROW][C]Trimmed Mean ( 21 / 28 )[/C][C]16634.0714285714[/C][C]128.488480631091[/C][C]129.459632076514[/C][/ROW]
[ROW][C]Trimmed Mean ( 22 / 28 )[/C][C]16621.85[/C][C]122.381044021929[/C][C]135.820462497620[/C][/ROW]
[ROW][C]Trimmed Mean ( 23 / 28 )[/C][C]16614.0263157895[/C][C]118.182065866699[/C][C]140.579928045334[/C][/ROW]
[ROW][C]Trimmed Mean ( 24 / 28 )[/C][C]16605.1944444444[/C][C]113.639333534223[/C][C]146.121892200677[/C][/ROW]
[ROW][C]Trimmed Mean ( 25 / 28 )[/C][C]16598.5[/C][C]109.312885978727[/C][C]151.843946405643[/C][/ROW]
[ROW][C]Trimmed Mean ( 26 / 28 )[/C][C]16588.8125[/C][C]104.623253034901[/C][C]158.557605683186[/C][/ROW]
[ROW][C]Trimmed Mean ( 27 / 28 )[/C][C]16578.4[/C][C]99.2121446959615[/C][C]167.100510232946[/C][/ROW]
[ROW][C]Trimmed Mean ( 28 / 28 )[/C][C]16577.8571428571[/C][C]95.9831984068943[/C][C]172.716240112982[/C][/ROW]
[ROW][C]Median[/C][C]16441.5[/C][C][/C][C][/C][/ROW]
[ROW][C]Midrange[/C][C]17422[/C][C][/C][C][/C][/ROW]
[ROW][C]Midmean - Weighted Average at Xnp[/C][C]16597.7906976744[/C][C][/C][C][/C][/ROW]
[ROW][C]Midmean - Weighted Average at X(n+1)p[/C][C]16634.0714285714[/C][C][/C][C][/C][/ROW]
[ROW][C]Midmean - Empirical Distribution Function[/C][C]16597.7906976744[/C][C][/C][C][/C][/ROW]
[ROW][C]Midmean - Empirical Distribution Function - Averaging[/C][C]16634.0714285714[/C][C][/C][C][/C][/ROW]
[ROW][C]Midmean - Empirical Distribution Function - Interpolation[/C][C]16634.0714285714[/C][C][/C][C][/C][/ROW]
[ROW][C]Midmean - Closest Observation[/C][C]16597.7906976744[/C][C][/C][C][/C][/ROW]
[ROW][C]Midmean - True Basic - Statistics Graphics Toolkit[/C][C]16634.0714285714[/C][C][/C][C][/C][/ROW]
[ROW][C]Midmean - MS Excel (old versions)[/C][C]16641.5227272727[/C][C][/C][C][/C][/ROW]
[ROW][C]Number of observations[/C][C]84[/C][C][/C][C][/C][/ROW]
[/TABLE]
Source: https://freestatistics.org/blog/index.php?pk=80084&T=1

Globally Unique Identifier (entire table): ba.freestatistics.org/blog/index.php?pk=80084&T=1

As an alternative you can also use a QR Code:  

The GUIDs for individual cells are displayed in the table below:

Central Tendency - Ungrouped Data
MeasureValueS.E.Value/S.E.
Arithmetic Mean16750.2857142857227.18059075978773.7311477986115
Geometric Mean16623.1754136431
Harmonic Mean16497.0390487161
Quadratic Mean16877.6712326700
Winsorized Mean ( 1 / 28 )16743.0714285714224.74433602765274.4983020462478
Winsorized Mean ( 2 / 28 )16727.4523809524217.84218432260276.7870209939723
Winsorized Mean ( 3 / 28 )16731.4166666667216.59633873947577.2469967130491
Winsorized Mean ( 4 / 28 )16731.6547619048215.71899850265477.5622679413605
Winsorized Mean ( 5 / 28 )16731.2976190476212.49842615580178.7361013524893
Winsorized Mean ( 6 / 28 )16751.7261904762208.09049991175980.5021190183108
Winsorized Mean ( 7 / 28 )16716.4761904762201.58580177672882.9248689299606
Winsorized Mean ( 8 / 28 )16713.1428571429200.93004575785883.1789133083856
Winsorized Mean ( 9 / 28 )16708.6428571429198.53314467892784.160470455271
Winsorized Mean ( 10 / 28 )16729.3571428571195.0802000829185.7563050260718
Winsorized Mean ( 11 / 28 )16718.0952380952189.55893155162888.1947112765928
Winsorized Mean ( 12 / 28 )16714.3809523810183.94136945413290.8679814768308
Winsorized Mean ( 13 / 28 )16708.8095238095182.98012118625891.3148893742476
Winsorized Mean ( 14 / 28 )16713.8095238095181.68058798806791.9955715076577
Winsorized Mean ( 15 / 28 )16736.6666666667170.19987518757298.33536392563
Winsorized Mean ( 16 / 28 )16758166.879663667344100.419665474669
Winsorized Mean ( 17 / 28 )16757.3928571429165.851009576273101.038835397841
Winsorized Mean ( 18 / 28 )16765.1071428571164.691548315605101.797009708898
Winsorized Mean ( 19 / 28 )16742.9404761905153.658430232897108.962068991682
Winsorized Mean ( 20 / 28 )16716.0357142857148.536903939802112.537930109680
Winsorized Mean ( 21 / 28 )16756.2857142857138.328354538653121.134136021285
Winsorized Mean ( 22 / 28 )16699.7142857143122.598179855146136.215026238118
Winsorized Mean ( 23 / 28 )16701.0833333333117.560599732180142.063611204611
Winsorized Mean ( 24 / 28 )16670.2261904762110.171874995066151.311087255461
Winsorized Mean ( 25 / 28 )16690.7619047619104.635569001931159.513271289745
Winsorized Mean ( 26 / 28 )16685.599.9560380992349166.928384890915
Winsorized Mean ( 27 / 28 )16583.285714285786.131987822671192.533414512939
Winsorized Mean ( 28 / 28 )16591.285714285784.5556635168089196.217320333457
Trimmed Mean ( 1 / 28 )16733.9024390244218.64355076563576.5350836117801
Trimmed Mean ( 2 / 28 )16724.275211.56115686333979.0517278689456
Trimmed Mean ( 3 / 28 )16722.5641025641207.61296055045880.5468216349618
Trimmed Mean ( 4 / 28 )16719.3026315789203.53838296561882.1432419181752
Trimmed Mean ( 5 / 28 )16715.7972972973199.06274555476483.9725045020974
Trimmed Mean ( 6 / 28 )16712.1805555556194.75794065585485.8100085638447
Trimmed Mean ( 7 / 28 )16704.2714285714190.82236319306987.5383322429066
Trimmed Mean ( 8 / 28 )16702.1176470588187.70618225235988.9801148083865
Trimmed Mean ( 9 / 28 )16700.3636363636184.10207039749790.7125248526845
Trimmed Mean ( 10 / 28 )16699.15625180.26712462237392.6356166438098
Trimmed Mean ( 11 / 28 )16695.0645161290176.32610477538694.6828862203704
Trimmed Mean ( 12 / 28 )16692.1333333333172.63010890612896.6930591604394
Trimmed Mean ( 13 / 28 )16689.4482758621169.18163789720698.6481067525929
Trimmed Mean ( 14 / 28 )16687.2142857143165.090920865242101.078933948981
Trimmed Mean ( 15 / 28 )16684.2592592593160.252816476993104.112112511012
Trimmed Mean ( 16 / 28 )16678.6153846154156.456674243764106.602134202531
Trimmed Mean ( 17 / 28 )16670.28152.266077640425109.481246633060
Trimmed Mean ( 18 / 28 )16661.3125147.109002610846113.258279264356
Trimmed Mean ( 19 / 28 )16650.7826086957140.690907015877118.350097826980
Trimmed Mean ( 20 / 28 )16641.5227272727134.888276879695123.37263928514
Trimmed Mean ( 21 / 28 )16634.0714285714128.488480631091129.459632076514
Trimmed Mean ( 22 / 28 )16621.85122.381044021929135.820462497620
Trimmed Mean ( 23 / 28 )16614.0263157895118.182065866699140.579928045334
Trimmed Mean ( 24 / 28 )16605.1944444444113.639333534223146.121892200677
Trimmed Mean ( 25 / 28 )16598.5109.312885978727151.843946405643
Trimmed Mean ( 26 / 28 )16588.8125104.623253034901158.557605683186
Trimmed Mean ( 27 / 28 )16578.499.2121446959615167.100510232946
Trimmed Mean ( 28 / 28 )16577.857142857195.9831984068943172.716240112982
Median16441.5
Midrange17422
Midmean - Weighted Average at Xnp16597.7906976744
Midmean - Weighted Average at X(n+1)p16634.0714285714
Midmean - Empirical Distribution Function16597.7906976744
Midmean - Empirical Distribution Function - Averaging16634.0714285714
Midmean - Empirical Distribution Function - Interpolation16634.0714285714
Midmean - Closest Observation16597.7906976744
Midmean - True Basic - Statistics Graphics Toolkit16634.0714285714
Midmean - MS Excel (old versions)16641.5227272727
Number of observations84


Parameters (Session):
par1 = 9 ; par2 = grey ; par3 = FALSE ; par4 = Unknown ;
Parameters (R input):
R code (references can be found in the software module):
geomean <- function(x) {
return(exp(mean(log(x))))
}
harmean <- function(x) {
return(1/mean(1/x))
}
quamean <- function(x) {
return(sqrt(mean(x*x)))
}
winmean <- function(x) {
x <-sort(x[!is.na(x)])
n<-length(x)
denom <- 3
nodenom <- n/denom
if (nodenom>40) denom <- n/40
sqrtn = sqrt(n)
roundnodenom = floor(nodenom)
win <- array(NA,dim=c(roundnodenom,2))
for (j in 1:roundnodenom) {
win[j,1] <- (j*x[j+1]+sum(x[(j+1):(n-j)])+j*x[n-j])/n
win[j,2] <- sd(c(rep(x[j+1],j),x[(j+1):(n-j)],rep(x[n-j],j)))/sqrtn
}
return(win)
}
trimean <- function(x) {
x <-sort(x[!is.na(x)])
n<-length(x)
denom <- 3
nodenom <- n/denom
if (nodenom>40) denom <- n/40
sqrtn = sqrt(n)
roundnodenom = floor(nodenom)
tri <- array(NA,dim=c(roundnodenom,2))
for (j in 1:roundnodenom) {
tri[j,1] <- mean(x,trim=j/n)
tri[j,2] <- sd(x[(j+1):(n-j)]) / sqrt(n-j*2)
}
return(tri)
}
midrange <- function(x) {
return((max(x)+min(x))/2)
}
q1 <- function(data,n,p,i,f) {
np <- n*p;
i <<- floor(np)
f <<- np - i
qvalue <- (1-f)*data[i] + f*data[i+1]
}
q2 <- function(data,n,p,i,f) {
np <- (n+1)*p
i <<- floor(np)
f <<- np - i
qvalue <- (1-f)*data[i] + f*data[i+1]
}
q3 <- function(data,n,p,i,f) {
np <- n*p
i <<- floor(np)
f <<- np - i
if (f==0) {
qvalue <- data[i]
} else {
qvalue <- data[i+1]
}
}
q4 <- function(data,n,p,i,f) {
np <- n*p
i <<- floor(np)
f <<- np - i
if (f==0) {
qvalue <- (data[i]+data[i+1])/2
} else {
qvalue <- data[i+1]
}
}
q5 <- function(data,n,p,i,f) {
np <- (n-1)*p
i <<- floor(np)
f <<- np - i
if (f==0) {
qvalue <- data[i+1]
} else {
qvalue <- data[i+1] + f*(data[i+2]-data[i+1])
}
}
q6 <- function(data,n,p,i,f) {
np <- n*p+0.5
i <<- floor(np)
f <<- np - i
qvalue <- data[i]
}
q7 <- function(data,n,p,i,f) {
np <- (n+1)*p
i <<- floor(np)
f <<- np - i
if (f==0) {
qvalue <- data[i]
} else {
qvalue <- f*data[i] + (1-f)*data[i+1]
}
}
q8 <- function(data,n,p,i,f) {
np <- (n+1)*p
i <<- floor(np)
f <<- np - i
if (f==0) {
qvalue <- data[i]
} else {
if (f == 0.5) {
qvalue <- (data[i]+data[i+1])/2
} else {
if (f < 0.5) {
qvalue <- data[i]
} else {
qvalue <- data[i+1]
}
}
}
}
midmean <- function(x,def) {
x <-sort(x[!is.na(x)])
n<-length(x)
if (def==1) {
qvalue1 <- q1(x,n,0.25,i,f)
qvalue3 <- q1(x,n,0.75,i,f)
}
if (def==2) {
qvalue1 <- q2(x,n,0.25,i,f)
qvalue3 <- q2(x,n,0.75,i,f)
}
if (def==3) {
qvalue1 <- q3(x,n,0.25,i,f)
qvalue3 <- q3(x,n,0.75,i,f)
}
if (def==4) {
qvalue1 <- q4(x,n,0.25,i,f)
qvalue3 <- q4(x,n,0.75,i,f)
}
if (def==5) {
qvalue1 <- q5(x,n,0.25,i,f)
qvalue3 <- q5(x,n,0.75,i,f)
}
if (def==6) {
qvalue1 <- q6(x,n,0.25,i,f)
qvalue3 <- q6(x,n,0.75,i,f)
}
if (def==7) {
qvalue1 <- q7(x,n,0.25,i,f)
qvalue3 <- q7(x,n,0.75,i,f)
}
if (def==8) {
qvalue1 <- q8(x,n,0.25,i,f)
qvalue3 <- q8(x,n,0.75,i,f)
}
midm <- 0
myn <- 0
roundno4 <- round(n/4)
round3no4 <- round(3*n/4)
for (i in 1:n) {
if ((x[i]>=qvalue1) & (x[i]<=qvalue3)){
midm = midm + x[i]
myn = myn + 1
}
}
midm = midm / myn
return(midm)
}
(arm <- mean(x))
sqrtn <- sqrt(length(x))
(armse <- sd(x) / sqrtn)
(armose <- arm / armse)
(geo <- geomean(x))
(har <- harmean(x))
(qua <- quamean(x))
(win <- winmean(x))
(tri <- trimean(x))
(midr <- midrange(x))
midm <- array(NA,dim=8)
for (j in 1:8) midm[j] <- midmean(x,j)
midm
bitmap(file='test1.png')
lb <- win[,1] - 2*win[,2]
ub <- win[,1] + 2*win[,2]
if ((ylimmin == '') | (ylimmax == '')) plot(win[,1],type='b',main=main, xlab='j', pch=19, ylab='Winsorized Mean(j/n)', ylim=c(min(lb),max(ub))) else plot(win[,1],type='l',main=main, xlab='j', pch=19, ylab='Winsorized Mean(j/n)', ylim=c(ylimmin,ylimmax))
lines(ub,lty=3)
lines(lb,lty=3)
grid()
dev.off()
bitmap(file='test2.png')
lb <- tri[,1] - 2*tri[,2]
ub <- tri[,1] + 2*tri[,2]
if ((ylimmin == '') | (ylimmax == '')) plot(tri[,1],type='b',main=main, xlab='j', pch=19, ylab='Trimmed Mean(j/n)', ylim=c(min(lb),max(ub))) else plot(tri[,1],type='l',main=main, xlab='j', pch=19, ylab='Trimmed Mean(j/n)', ylim=c(ylimmin,ylimmax))
lines(ub,lty=3)
lines(lb,lty=3)
grid()
dev.off()
load(file='createtable')
a<-table.start()
a<-table.row.start(a)
a<-table.element(a,'Central Tendency - Ungrouped Data',4,TRUE)
a<-table.row.end(a)
a<-table.row.start(a)
a<-table.element(a,'Measure',header=TRUE)
a<-table.element(a,'Value',header=TRUE)
a<-table.element(a,'S.E.',header=TRUE)
a<-table.element(a,'Value/S.E.',header=TRUE)
a<-table.row.end(a)
a<-table.row.start(a)
a<-table.element(a,hyperlink('arithmetic_mean.htm', 'Arithmetic Mean', 'click to view the definition of the Arithmetic Mean'),header=TRUE)
a<-table.element(a,arm)
a<-table.element(a,hyperlink('arithmetic_mean_standard_error.htm', armse, 'click to view the definition of the Standard Error of the Arithmetic Mean'))
a<-table.element(a,armose)
a<-table.row.end(a)
a<-table.row.start(a)
a<-table.element(a,hyperlink('geometric_mean.htm', 'Geometric Mean', 'click to view the definition of the Geometric Mean'),header=TRUE)
a<-table.element(a,geo)
a<-table.element(a,'')
a<-table.row.end(a)
a<-table.row.start(a)
a<-table.element(a,hyperlink('harmonic_mean.htm', 'Harmonic Mean', 'click to view the definition of the Harmonic Mean'),header=TRUE)
a<-table.element(a,har)
a<-table.element(a,'')
a<-table.row.end(a)
a<-table.row.start(a)
a<-table.element(a,hyperlink('quadratic_mean.htm', 'Quadratic Mean', 'click to view the definition of the Quadratic Mean'),header=TRUE)
a<-table.element(a,qua)
a<-table.element(a,'')
a<-table.row.end(a)
for (j in 1:length(win[,1])) {
a<-table.row.start(a)
mylabel <- paste('Winsorized Mean (',j)
mylabel <- paste(mylabel,'/')
mylabel <- paste(mylabel,length(win[,1]))
mylabel <- paste(mylabel,')')
a<-table.element(a,hyperlink('winsorized_mean.htm', mylabel, 'click to view the definition of the Winsorized Mean'),header=TRUE)
a<-table.element(a,win[j,1])
a<-table.element(a,win[j,2])
a<-table.element(a,win[j,1]/win[j,2])
a<-table.row.end(a)
}
for (j in 1:length(tri[,1])) {
a<-table.row.start(a)
mylabel <- paste('Trimmed Mean (',j)
mylabel <- paste(mylabel,'/')
mylabel <- paste(mylabel,length(tri[,1]))
mylabel <- paste(mylabel,')')
a<-table.element(a,hyperlink('arithmetic_mean.htm', mylabel, 'click to view the definition of the Trimmed Mean'),header=TRUE)
a<-table.element(a,tri[j,1])
a<-table.element(a,tri[j,2])
a<-table.element(a,tri[j,1]/tri[j,2])
a<-table.row.end(a)
}
a<-table.row.start(a)
a<-table.element(a,hyperlink('median_1.htm', 'Median', 'click to view the definition of the Median'),header=TRUE)
a<-table.element(a,median(x))
a<-table.element(a,'')
a<-table.row.end(a)
a<-table.row.start(a)
a<-table.element(a,hyperlink('midrange.htm', 'Midrange', 'click to view the definition of the Midrange'),header=TRUE)
a<-table.element(a,midr)
a<-table.element(a,'')
a<-table.row.end(a)
a<-table.row.start(a)
mymid <- hyperlink('midmean.htm', 'Midmean', 'click to view the definition of the Midmean')
mylabel <- paste(mymid,hyperlink('method_1.htm','Weighted Average at Xnp',''),sep=' - ')
a<-table.element(a,mylabel,header=TRUE)
a<-table.element(a,midm[1])
a<-table.element(a,'')
a<-table.row.end(a)
a<-table.row.start(a)
mymid <- hyperlink('midmean.htm', 'Midmean', 'click to view the definition of the Midmean')
mylabel <- paste(mymid,hyperlink('method_2.htm','Weighted Average at X(n+1)p',''),sep=' - ')
a<-table.element(a,mylabel,header=TRUE)
a<-table.element(a,midm[2])
a<-table.element(a,'')
a<-table.row.end(a)
a<-table.row.start(a)
mymid <- hyperlink('midmean.htm', 'Midmean', 'click to view the definition of the Midmean')
mylabel <- paste(mymid,hyperlink('method_3.htm','Empirical Distribution Function',''),sep=' - ')
a<-table.element(a,mylabel,header=TRUE)
a<-table.element(a,midm[3])
a<-table.element(a,'')
a<-table.row.end(a)
a<-table.row.start(a)
mymid <- hyperlink('midmean.htm', 'Midmean', 'click to view the definition of the Midmean')
mylabel <- paste(mymid,hyperlink('method_4.htm','Empirical Distribution Function - Averaging',''),sep=' - ')
a<-table.element(a,mylabel,header=TRUE)
a<-table.element(a,midm[4])
a<-table.element(a,'')
a<-table.row.end(a)
a<-table.row.start(a)
mymid <- hyperlink('midmean.htm', 'Midmean', 'click to view the definition of the Midmean')
mylabel <- paste(mymid,hyperlink('method_5.htm','Empirical Distribution Function - Interpolation',''),sep=' - ')
a<-table.element(a,mylabel,header=TRUE)
a<-table.element(a,midm[5])
a<-table.element(a,'')
a<-table.row.end(a)
a<-table.row.start(a)
mymid <- hyperlink('midmean.htm', 'Midmean', 'click to view the definition of the Midmean')
mylabel <- paste(mymid,hyperlink('method_6.htm','Closest Observation',''),sep=' - ')
a<-table.element(a,mylabel,header=TRUE)
a<-table.element(a,midm[6])
a<-table.element(a,'')
a<-table.row.end(a)
a<-table.row.start(a)
mymid <- hyperlink('midmean.htm', 'Midmean', 'click to view the definition of the Midmean')
mylabel <- paste(mymid,hyperlink('method_7.htm','True Basic - Statistics Graphics Toolkit',''),sep=' - ')
a<-table.element(a,mylabel,header=TRUE)
a<-table.element(a,midm[7])
a<-table.element(a,'')
a<-table.row.end(a)
a<-table.row.start(a)
mymid <- hyperlink('midmean.htm', 'Midmean', 'click to view the definition of the Midmean')
mylabel <- paste(mymid,hyperlink('method_8.htm','MS Excel (old versions)',''),sep=' - ')
a<-table.element(a,mylabel,header=TRUE)
a<-table.element(a,midm[8])
a<-table.element(a,'')
a<-table.row.end(a)
a<-table.row.start(a)
a<-table.element(a,'Number of observations',header=TRUE)
a<-table.element(a,length(x))
a<-table.element(a,'')
a<-table.row.end(a)
a<-table.end(a)
table.save(a,file='mytable.tab')