| Multiple Linear Regression - Estimated Regression Equation |
| Wman[t] = + 9.66287356011315 -0.0238024768072979Ecogr[t] + e[t] |
| Multiple Linear Regression - Ordinary Least Squares | |||||
| Variable | Parameter | S.D. | T-STAT H0: parameter = 0 | 2-tail p-value | 1-tail p-value |
| (Intercept) | 9.66287356011315 | 0.900642 | 10.7289 | 0 | 0 |
| Ecogr | -0.0238024768072979 | 0.008571 | -2.7771 | 0.007374 | 0.003687 |
| Multiple Linear Regression - Regression Statistics | |
| Multiple R | 0.342588997638699 |
| R-squared | 0.117367221303089 |
| Adjusted R-squared | 0.102149414773832 |
| F-TEST (value) | 7.7124926695213 |
| F-TEST (DF numerator) | 1 |
| F-TEST (DF denominator) | 58 |
| p-value | 0.00737384572121003 |
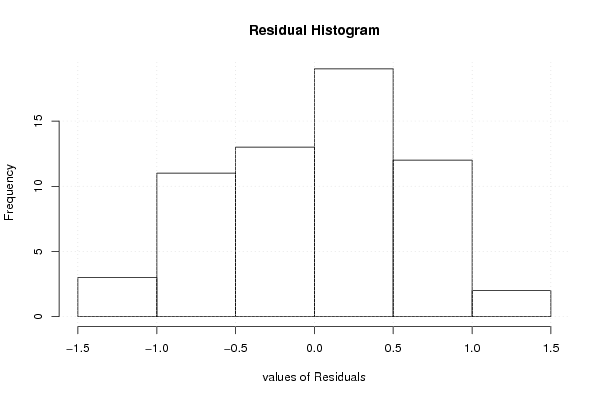
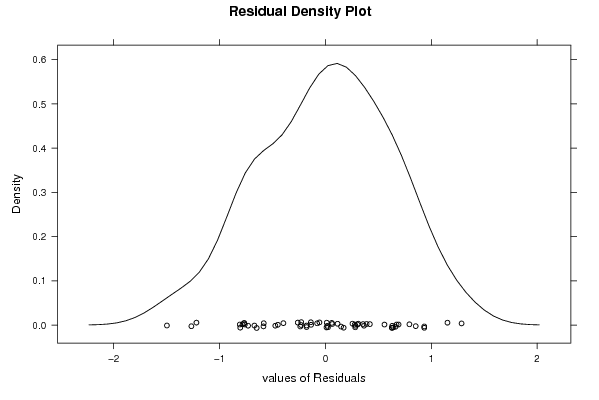
| Multiple Linear Regression - Residual Statistics | |
| Residual Standard Deviation | 0.623206484191725 |
| Sum Squared Residuals | 22.5264066724394 |
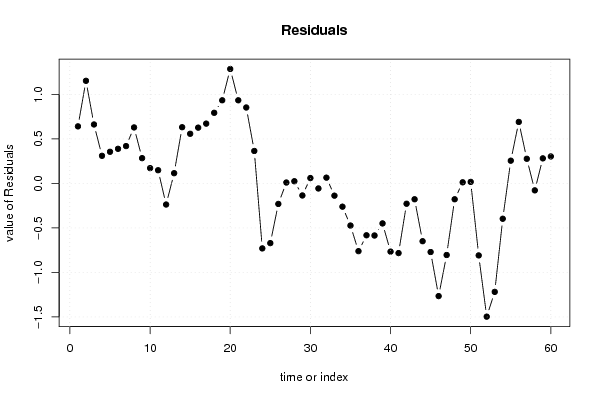
| Multiple Linear Regression - Actuals, Interpolation, and Residuals | |||
| Time or Index | Actuals | Interpolation Forecast | Residuals Prediction Error |
| 1 | 8 | 7.35879380516671 | 0.641206194833285 |
| 2 | 8.1 | 6.94701095640045 | 1.15298904359955 |
| 3 | 7.7 | 7.03746036826819 | 0.662539631731815 |
| 4 | 7.5 | 7.18979621983489 | 0.310203780165108 |
| 5 | 7.6 | 7.24454191649168 | 0.355458083508323 |
| 6 | 7.8 | 7.41115925414276 | 0.388840745857237 |
| 7 | 7.8 | 7.38021603429327 | 0.419783965706725 |
| 8 | 7.8 | 7.17075423838905 | 0.629245761610946 |
| 9 | 7.5 | 7.21597894432292 | 0.284021055677080 |
| 10 | 7.5 | 7.32785058531722 | 0.17214941468278 |
| 11 | 7.1 | 6.95177145176191 | 0.148228548238087 |
| 12 | 7.5 | 7.73725318640274 | -0.237253186402744 |
| 13 | 7.5 | 7.38497652965473 | 0.115023470345265 |
| 14 | 7.6 | 6.96843318552702 | 0.631566814472979 |
| 15 | 7.7 | 7.1421912662203 | 0.557808733779704 |
| 16 | 7.7 | 7.07316408347913 | 0.626835916520868 |
| 17 | 7.9 | 7.22788018272657 | 0.672119817273432 |
| 18 | 8.1 | 7.30642835619065 | 0.793571643809348 |
| 19 | 8.2 | 7.26596414561824 | 0.934035854381754 |
| 20 | 8.2 | 6.91368748887024 | 1.28631251112976 |
| 21 | 8.2 | 7.26596414561824 | 0.934035854381754 |
| 22 | 7.9 | 7.0469813589911 | 0.853018641008896 |
| 23 | 7.3 | 6.9351097179968 | 0.364890282003196 |
| 24 | 6.9 | 7.6301420407699 | -0.730142040769903 |
| 25 | 6.6 | 7.2707246409797 | -0.670724640979705 |
| 26 | 6.7 | 6.93034922263534 | -0.230349222635344 |
| 27 | 6.9 | 6.88988501206294 | 0.0101149879370625 |
| 28 | 7 | 6.97557392856921 | 0.0244260714307898 |
| 29 | 7.1 | 7.23502092576876 | -0.135020925768758 |
| 30 | 7.2 | 7.13981101853957 | 0.0601889814604341 |
| 31 | 7.1 | 7.15647275230467 | -0.056472752304675 |
| 32 | 6.9 | 6.83513931540615 | 0.0648606845938478 |
| 33 | 7 | 7.13743077085884 | -0.137430770858836 |
| 34 | 6.8 | 7.06126284507548 | -0.261262845075483 |
| 35 | 6.4 | 6.87322327829783 | -0.473223278297829 |
| 36 | 6.7 | 7.46114445543809 | -0.761144455438088 |
| 37 | 6.6 | 7.1826554767927 | -0.582655476792703 |
| 38 | 6.4 | 6.98509491929213 | -0.585094919292129 |
| 39 | 6.3 | 6.74945039889988 | -0.44945039889988 |
| 40 | 6.2 | 6.96605293784629 | -0.766052937846291 |
| 41 | 6.5 | 7.28262587938335 | -0.782625879383354 |
| 42 | 6.8 | 7.02793937754527 | -0.227939377545266 |
| 43 | 6.8 | 6.97795417624994 | -0.177954176249940 |
| 44 | 6.4 | 7.04936160667183 | -0.649361606671834 |
| 45 | 6.1 | 6.8708430306171 | -0.7708430306171 |
| 46 | 5.8 | 7.06602334043694 | -1.26602334043694 |
| 47 | 6.1 | 6.90416649814732 | -0.804166498147317 |
| 48 | 7.2 | 7.37783578661255 | -0.177835786612545 |
| 49 | 7.3 | 7.28738637474481 | 0.0126136252551865 |
| 50 | 6.9 | 6.88274426902075 | 0.0172557309792519 |
| 51 | 6.1 | 6.90892699350878 | -0.808926993508776 |
| 52 | 5.8 | 7.29690736546773 | -1.49690736546773 |
| 53 | 6.2 | 7.41829999718495 | -1.21829999718495 |
| 54 | 7.1 | 7.49684817064904 | -0.396848170649035 |
| 55 | 7.7 | 7.44448272167298 | 0.255517278327021 |
| 56 | 7.9 | 7.20883820128073 | 0.69116179871927 |
| 57 | 7.7 | 7.42306049254641 | 0.276939507453589 |
| 58 | 7.4 | 7.4778061892032 | -0.0778061892031964 |
| 59 | 7.5 | 7.21835919200365 | 0.281640807996351 |
| 60 | 8 | 7.69678897583034 | 0.303211024169662 |
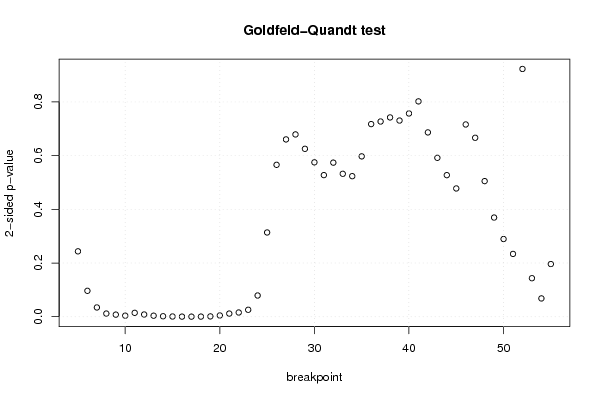
| Goldfeld-Quandt test for Heteroskedasticity | |||
| p-values | Alternative Hypothesis | ||
| breakpoint index | greater | 2-sided | less |
| 5 | 0.121785386787318 | 0.243570773574637 | 0.878214613212682 |
| 6 | 0.0482542743810077 | 0.0965085487620153 | 0.951745725618992 |
| 7 | 0.0172541545434744 | 0.0345083090869488 | 0.982745845456526 |
| 8 | 0.00585317028991931 | 0.0117063405798386 | 0.99414682971008 |
| 9 | 0.00386792553146366 | 0.00773585106292731 | 0.996132074468536 |
| 10 | 0.00197414236000052 | 0.00394828472000104 | 0.99802585764 |
| 11 | 0.0072408102533972 | 0.0144816205067944 | 0.992759189746603 |
| 12 | 0.00414850298133946 | 0.00829700596267893 | 0.99585149701866 |
| 13 | 0.00190628899466354 | 0.00381257798932708 | 0.998093711005337 |
| 14 | 0.000862503251589 | 0.001725006503178 | 0.99913749674841 |
| 15 | 0.000378300013743677 | 0.000756600027487354 | 0.999621699986256 |
| 16 | 0.000170905262863513 | 0.000341810525727026 | 0.999829094737136 |
| 17 | 0.000120847192389412 | 0.000241694384778824 | 0.99987915280761 |
| 18 | 0.000214259986826536 | 0.000428519973653071 | 0.999785740013173 |
| 19 | 0.00060408894734389 | 0.00120817789468778 | 0.999395911052656 |
| 20 | 0.00233941189718986 | 0.00467882379437973 | 0.99766058810281 |
| 21 | 0.00584857805943207 | 0.0116971561188641 | 0.994151421940568 |
| 22 | 0.00785841516550374 | 0.0157168303310075 | 0.992141584834496 |
| 23 | 0.0129086370286779 | 0.0258172740573558 | 0.987091362971322 |
| 24 | 0.0395209898875724 | 0.0790419797751449 | 0.960479010112428 |
| 25 | 0.156897225433393 | 0.313794450866786 | 0.843102774566607 |
| 26 | 0.282894270366896 | 0.565788540733793 | 0.717105729633104 |
| 27 | 0.330203914449691 | 0.660407828899382 | 0.669796085550309 |
| 28 | 0.339483349126674 | 0.678966698253347 | 0.660516650873326 |
| 29 | 0.312701198088229 | 0.625402396176457 | 0.687298801911771 |
| 30 | 0.287511192283293 | 0.575022384566586 | 0.712488807716707 |
| 31 | 0.263706789472349 | 0.527413578944699 | 0.736293210527651 |
| 32 | 0.286965280095144 | 0.573930560190289 | 0.713034719904856 |
| 33 | 0.26615271905395 | 0.5323054381079 | 0.73384728094605 |
| 34 | 0.261760855112603 | 0.523521710225205 | 0.738239144887397 |
| 35 | 0.298643433495721 | 0.597286866991441 | 0.701356566504279 |
| 36 | 0.358738009454688 | 0.717476018909376 | 0.641261990545312 |
| 37 | 0.363541481662976 | 0.727082963325952 | 0.636458518337024 |
| 38 | 0.37113706163833 | 0.74227412327666 | 0.62886293836167 |
| 39 | 0.365330103064557 | 0.730660206129115 | 0.634669896935443 |
| 40 | 0.378534222463802 | 0.757068444927605 | 0.621465777536198 |
| 41 | 0.401037076694803 | 0.802074153389605 | 0.598962923305197 |
| 42 | 0.343246881890372 | 0.686493763780744 | 0.656753118109628 |
| 43 | 0.295924651955832 | 0.591849303911664 | 0.704075348044168 |
| 44 | 0.26363311443066 | 0.52726622886132 | 0.73636688556934 |
| 45 | 0.238869592112753 | 0.477739184225507 | 0.761130407887247 |
| 46 | 0.358020546570695 | 0.71604109314139 | 0.641979453429305 |
| 47 | 0.33323899923475 | 0.6664779984695 | 0.66676100076525 |
| 48 | 0.252515951564903 | 0.505031903129806 | 0.747484048435097 |
| 49 | 0.184704526638826 | 0.369409053277651 | 0.815295473361174 |
| 50 | 0.144715450787085 | 0.289430901574171 | 0.855284549212915 |
| 51 | 0.116928407049026 | 0.233856814098052 | 0.883071592950974 |
| 52 | 0.461422434030424 | 0.922844868060848 | 0.538577565969576 |
| 53 | 0.928282892788987 | 0.143434214422026 | 0.071717107211013 |
| 54 | 0.965930471688251 | 0.0681390566234972 | 0.0340695283117486 |
| 55 | 0.901895543659822 | 0.196208912680357 | 0.0981044563401784 |
| Meta Analysis of Goldfeld-Quandt test for Heteroskedasticity | |||
| Description | # significant tests | % significant tests | OK/NOK |
| 1% type I error level | 11 | 0.215686274509804 | NOK |
| 5% type I error level | 17 | 0.333333333333333 | NOK |
| 10% type I error level | 20 | 0.392156862745098 | NOK |