| Multiple Linear Regression - Estimated Regression Equation |
| Wman[t] = + 10.4164058531152 -0.025382099948453Ecogr[t] -0.0192854525358532t + e[t] |
| Multiple Linear Regression - Ordinary Least Squares | |||||
| Variable | Parameter | S.D. | T-STAT H0: parameter = 0 | 2-tail p-value | 1-tail p-value |
| (Intercept) | 10.4164058531152 | 0.777349 | 13.3999 | 0 | 0 |
| Ecogr | -0.025382099948453 | 0.007259 | -3.4968 | 0.00092 | 0.00046 |
| t | -0.0192854525358532 | 0.003934 | -4.9017 | 8e-06 | 4e-06 |
| Multiple Linear Regression - Regression Statistics | |
| Multiple R | 0.615703458936818 |
| R-squared | 0.379090749346763 |
| Adjusted R-squared | 0.357304459850158 |
| F-TEST (value) | 17.4004274296383 |
| F-TEST (DF numerator) | 2 |
| F-TEST (DF denominator) | 57 |
| p-value | 1.26270445377497e-06 |
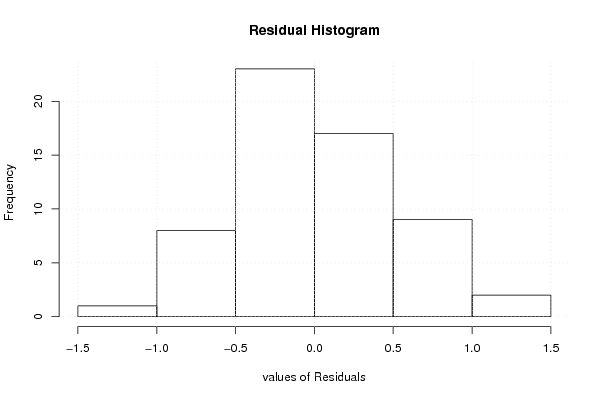
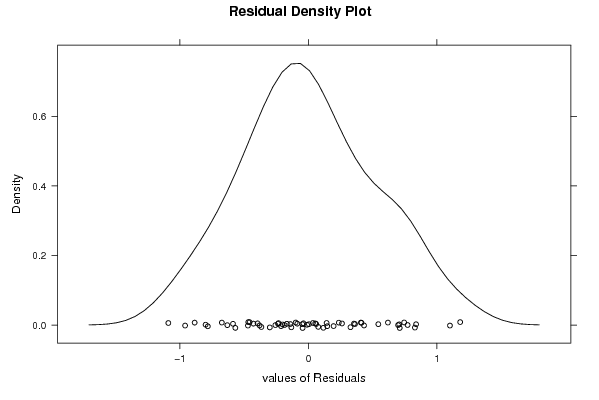
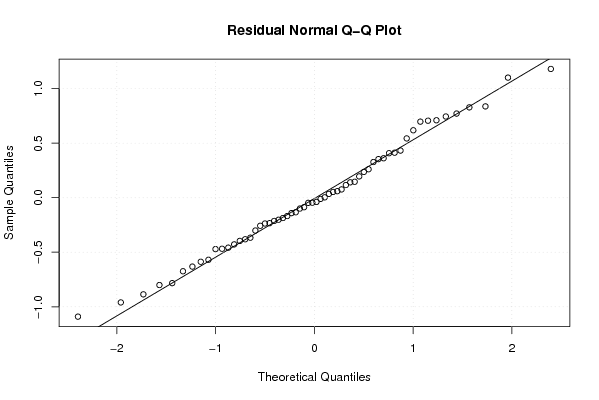
| Multiple Linear Regression - Residual Statistics | |
| Residual Standard Deviation | 0.52726940432956 |
| Sum Squared Residuals | 15.8467424102968 |
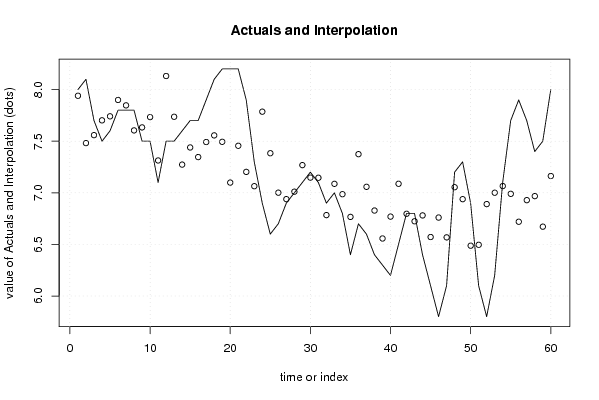
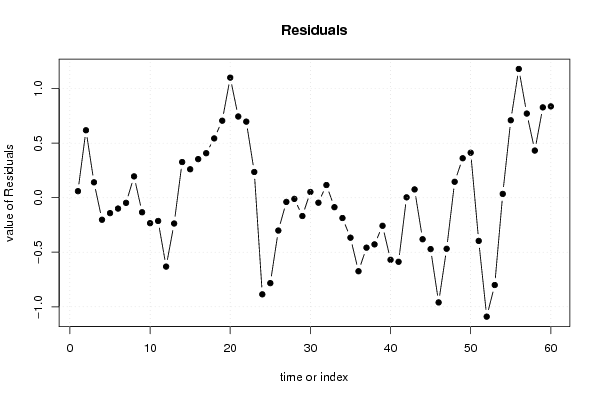
| Multiple Linear Regression - Actuals, Interpolation, and Residuals | |||
| Time or Index | Actuals | Interpolation Forecast | Residuals Prediction Error |
| 1 | 8 | 7.9401331255691 | 0.0598668744309016 |
| 2 | 8.1 | 7.481737343925 | 0.618262656075 |
| 3 | 7.7 | 7.55890387119326 | 0.141096128806736 |
| 4 | 7.5 | 7.70206385832751 | -0.202063858327513 |
| 5 | 7.6 | 7.7411572356731 | -0.141157235673102 |
| 6 | 7.8 | 7.89954648277642 | -0.0995464827764202 |
| 7 | 7.8 | 7.84726430030758 | -0.0472643003075778 |
| 8 | 7.8 | 7.60461636822534 | 0.195383631774662 |
| 9 | 7.5 | 7.63355690559155 | -0.133556905591546 |
| 10 | 7.5 | 7.73356732281342 | -0.233567322813422 |
| 11 | 7.1 | 7.31324469109201 | -0.213244691092011 |
| 12 | 7.5 | 8.1315685368551 | -0.631568536855107 |
| 13 | 7.5 | 7.73662800508215 | -0.236628005082149 |
| 14 | 7.6 | 7.27315580344837 | 0.326844196551631 |
| 15 | 7.7 | 7.43915968053622 | 0.260840319463778 |
| 16 | 7.7 | 7.34626613814986 | 0.353733861850144 |
| 17 | 7.9 | 7.49196433527895 | 0.408035664721053 |
| 18 | 8.1 | 7.55643981257299 | 0.543560187427011 |
| 19 | 8.2 | 7.49400479012477 | 0.705995209875234 |
| 20 | 8.2 | 7.09906425835181 | 1.10093574164819 |
| 21 | 8.2 | 7.45543388505306 | 0.74456611494694 |
| 22 | 7.9 | 7.20263311299144 | 0.697366887008562 |
| 23 | 7.3 | 7.06405179069786 | 0.235948209302143 |
| 24 | 6.9 | 7.78592365665683 | -0.88592365665683 |
| 25 | 6.6 | 7.38336849489934 | -0.783368494899338 |
| 26 | 6.7 | 7.0011190131006 | -0.301119013100606 |
| 27 | 6.9 | 6.93868399065238 | -0.0386839906523827 |
| 28 | 7 | 7.01077409793096 | -0.0107740979309606 |
| 29 | 7.1 | 7.26815353483325 | -0.168153534833246 |
| 30 | 7.2 | 7.14733968250358 | 0.05266031749642 |
| 31 | 7.1 | 7.14582169993164 | -0.0458216999316445 |
| 32 | 6.9 | 6.78387789809168 | 0.116122101908325 |
| 33 | 7 | 7.08694511490118 | -0.0869451149011756 |
| 34 | 6.8 | 6.98643694253027 | -0.186436942530273 |
| 35 | 6.4 | 6.76663290040164 | -0.36663290040164 |
| 36 | 6.7 | 7.37428531659258 | -0.674285316592577 |
| 37 | 6.6 | 7.05802929465982 | -0.458029294659824 |
| 38 | 6.4 | 6.82807241255181 | -0.42807241255181 |
| 39 | 6.3 | 6.55750417052627 | -0.257504170526273 |
| 40 | 6.2 | 6.76919582752134 | -0.569195827521342 |
| 41 | 6.5 | 7.08749230429991 | -0.587492304299914 |
| 42 | 6.8 | 6.79661838231561 | 0.00338161768438656 |
| 43 | 6.8 | 6.72403051988801 | 0.0759694801119909 |
| 44 | 6.4 | 6.78089136719751 | -0.380891367197514 |
| 45 | 6.1 | 6.57124016504826 | -0.471240165048265 |
| 46 | 5.8 | 6.76008793208973 | -0.960087932089726 |
| 47 | 6.1 | 6.56820419990439 | -0.468204199904392 |
| 48 | 7.2 | 7.05402253634275 | 0.145977463657247 |
| 49 | 7.3 | 6.93828510400278 | 0.361714895997221 |
| 50 | 6.9 | 6.48750395234322 | 0.412496047656775 |
| 51 | 6.1 | 6.49613880975067 | -0.39613880975067 |
| 52 | 5.8 | 6.8905815863746 | -1.0905815863746 |
| 53 | 6.2 | 7.00074484357586 | -0.800744843575858 |
| 54 | 7.1 | 7.0652203208699 | 0.0347796791300999 |
| 55 | 7.7 | 6.99009424844745 | 0.70990575155255 |
| 56 | 7.9 | 6.71952600642191 | 1.18047399357809 |
| 57 | 7.7 | 6.92867945342214 | 0.771320546577864 |
| 58 | 7.4 | 6.96777283076772 | 0.432227169232275 |
| 59 | 7.5 | 6.67182248879373 | 0.828177511206266 |
| 60 | 8 | 7.16271724522179 | 0.837282754778214 |
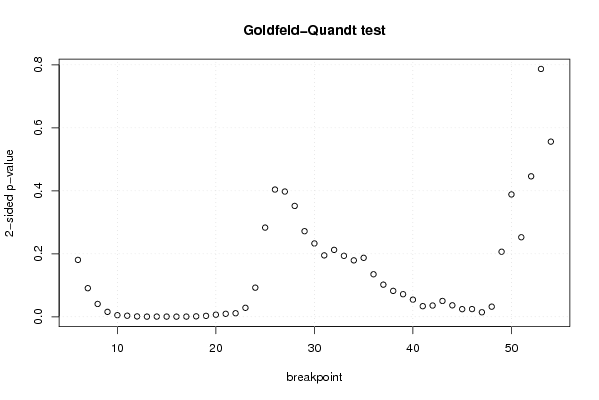
| Goldfeld-Quandt test for Heteroskedasticity | |||
| p-values | Alternative Hypothesis | ||
| breakpoint index | greater | 2-sided | less |
| 6 | 0.0903249971622906 | 0.180649994324581 | 0.90967500283771 |
| 7 | 0.0454168657712525 | 0.0908337315425049 | 0.954583134228748 |
| 8 | 0.0204064332956071 | 0.0408128665912143 | 0.979593566704393 |
| 9 | 0.00785681234175401 | 0.0157136246835080 | 0.992143187658246 |
| 10 | 0.00253986862930999 | 0.00507973725861999 | 0.99746013137069 |
| 11 | 0.00168799620858192 | 0.00337599241716384 | 0.998312003791418 |
| 12 | 0.000604941626702323 | 0.00120988325340465 | 0.999395058373298 |
| 13 | 0.000268979843018697 | 0.000537959686037394 | 0.999731020156981 |
| 14 | 0.000346875315716867 | 0.000693750631433734 | 0.999653124684283 |
| 15 | 0.000326748863188730 | 0.000653497726377461 | 0.999673251136811 |
| 16 | 0.00022507580843412 | 0.00045015161686824 | 0.999774924191566 |
| 17 | 0.000313950041144808 | 0.000627900082289617 | 0.999686049958855 |
| 18 | 0.000725527195231403 | 0.00145105439046281 | 0.999274472804769 |
| 19 | 0.00147758006019192 | 0.00295516012038384 | 0.998522419939808 |
| 20 | 0.00331979594394545 | 0.0066395918878909 | 0.996680204056055 |
| 21 | 0.00472180657502634 | 0.00944361315005268 | 0.995278193424974 |
| 22 | 0.00562598495685947 | 0.0112519699137189 | 0.99437401504314 |
| 23 | 0.0142707688049946 | 0.0285415376099893 | 0.985729231195005 |
| 24 | 0.0462346647435626 | 0.0924693294871253 | 0.953765335256437 |
| 25 | 0.141625324509694 | 0.283250649019387 | 0.858374675490306 |
| 26 | 0.202039373301667 | 0.404078746603335 | 0.797960626698333 |
| 27 | 0.198865389407924 | 0.397730778815847 | 0.801134610592076 |
| 28 | 0.176025184750191 | 0.352050369500381 | 0.823974815249809 |
| 29 | 0.135898358587873 | 0.271796717175747 | 0.864101641412127 |
| 30 | 0.116452666816436 | 0.232905333632873 | 0.883547333183564 |
| 31 | 0.0975141129043033 | 0.195028225808607 | 0.902485887095697 |
| 32 | 0.10625149386293 | 0.21250298772586 | 0.89374850613707 |
| 33 | 0.0967984003058166 | 0.193596800611633 | 0.903201599694183 |
| 34 | 0.0896265431674792 | 0.179253086334958 | 0.910373456832521 |
| 35 | 0.0936439053184516 | 0.187287810636903 | 0.906356094681548 |
| 36 | 0.0675378508549491 | 0.135075701709898 | 0.932462149145051 |
| 37 | 0.0509974359785744 | 0.101994871957149 | 0.949002564021426 |
| 38 | 0.0411233287325455 | 0.082246657465091 | 0.958876671267455 |
| 39 | 0.0358562701775443 | 0.0717125403550885 | 0.964143729822456 |
| 40 | 0.0272169196643573 | 0.0544338393287146 | 0.972783080335643 |
| 41 | 0.0168528910723861 | 0.0337057821447723 | 0.983147108927614 |
| 42 | 0.0178642549025567 | 0.0357285098051134 | 0.982135745097443 |
| 43 | 0.0251530289526603 | 0.0503060579053205 | 0.97484697104734 |
| 44 | 0.0182293099056828 | 0.0364586198113655 | 0.981770690094317 |
| 45 | 0.0121163587022265 | 0.0242327174044530 | 0.987883641297774 |
| 46 | 0.0122858682995929 | 0.0245717365991859 | 0.987714131700407 |
| 47 | 0.00719444606876881 | 0.0143888921375376 | 0.992805553931231 |
| 48 | 0.0160594809360182 | 0.0321189618720364 | 0.983940519063982 |
| 49 | 0.103307156676546 | 0.206614313353092 | 0.896692843323454 |
| 50 | 0.194279539285227 | 0.388559078570455 | 0.805720460714773 |
| 51 | 0.126287762873867 | 0.252575525747735 | 0.873712237126133 |
| 52 | 0.223043984638691 | 0.446087969277383 | 0.776956015361309 |
| 53 | 0.606476015151 | 0.787047969698 | 0.393523984849 |
| 54 | 0.721908142993627 | 0.556183714012747 | 0.278091857006373 |
| Meta Analysis of Goldfeld-Quandt test for Heteroskedasticity | |||
| Description | # significant tests | % significant tests | OK/NOK |
| 1% type I error level | 12 | 0.244897959183673 | NOK |
| 5% type I error level | 23 | 0.469387755102041 | NOK |
| 10% type I error level | 29 | 0.591836734693878 | NOK |